(1) Introduction
The Common Weakness Scoring System (CWSS) provides a mechanism for
prioritizing software weaknesses in a consistent, flexible, open
manner. It is a collaborative, community-based effort that is
addressing the needs of its stakeholders across government, academia,
and industry.
Software developers often face hundreds or thousands of individual
bug reports for weaknesses that are discovered in their code. In
certain circumstances, a software weakness can even lead to an
exploitable vulnerability. Due to this high volume of reported
weaknesses, stakeholders are often forced to prioritize which issues
they should investigate and fix first, often using incomplete
information. In short, people need to be able to reason and
communicate about the relative importance of different
weaknesses. While various scoring methods are used today, they are
either ad hoc or inappropriate for application to the still-imprecise
evaluation of software security.
Software developers, managers, testers, security vendors and
service suppliers, buyers, application vendors, and researchers must
identify and assess weaknesses in software that could manifest as
vulnerabilities when the software is used. They then need to be able
to prioritize these weaknesses and determine which to remediate based
on which of them pose the greatest risk. When there are so many
weaknesses to fix, with each being scored using different scales, and
often operating with incomplete information, the various community
members, managers, testers, buyers, and developers are left to their
own methodologies to find some way of comparing disparate weaknesses
and translating them into actionable information.
Because CWSS standardizes the approach for characterizing
weaknesses, users of CWSS can invoke attack surface and environmental
metrics to apply contextual information that more accurately reflects
the risk to the software capability, given the unique business context
it will function within and the unique business capability it is meant
to provide. This allows stakeholders to make more informed decisions
when trying to mitigate risks posed by weaknesses.
CWSS is distinct from - but not a competitor to
- the Common Vulnerability Scoring System (CVSS). These efforts have
different roles, and they can be leveraged together.
CWSS offers:
- Quantitative Measurements: CWSS provides a quantitative
measurement of the unfixed weaknesses that are present within a
software application.
- Common Framework: CWSS provides a
common framework for prioritizing security errors
("weaknesses") that are discovered in software
applications.
- Customized Prioritization: in conjunction with
the Common Weakness Risk Analysis Framework
(CWRAF), CWSS can be used by consumers to identify the most
important types of weaknesses for their business domains, in
order to inform their acquisition and protection activities as
one part of the larger process of achieving software
assurance.
1.1 What is CWSS?
CWSS is organized into three metric groups: Base Finding, Attack
Surface, and Environmental. Each group contains multiple metrics -
also known as factors - that are used to compute a CWSS score
for a weakness.
- Base Finding metric group: captures the inherent risk of the
weakness, confidence in the accuracy of the finding, and strength of
controls.
- Attack Surface metric group: the barriers that an
attacker must overcome in order to exploit the weakness.
- Environmental metric group: characteristics of the
weakness that are specific to a particular environment or
operational context.
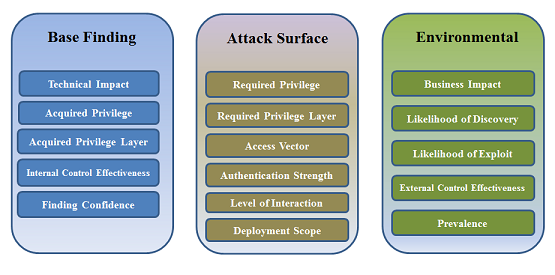
Figure 1: CWSS Metric Groups
1.2 Other weakness scoring systems
Various weakness scoring systems have been used or proposed over the
years. Automated tools such as source code scanners typically perform
their own custom scoring; as a result, multiple tools can produce
inconsistent scores for the same weakness.
The Common Vulnerability Scoring System (CVSS) is perhaps the most
similar scoring system. However, it has some important limitations
that make it difficult to adapt to software security assessment. A
more detailed comparison is in Appendix
A.
More details on other scoring systems, including adaptations to
CVSS, are provided in Appendix B.
1.3 How does CWSS work?
1.3.1 Score Calculation
Each factor in the Base Finding metric group is assigned a value.
These values are converted to associated weights, and a Base Finding
subscore is calculated. The Base Finding subscore can range between
0 and 100. The same method is applied to the Attack Surface and
Environmental metric group; their subscores can range between 0 and
1. Finally, the three subscores are multiplied together, which
produces a CWSS score between 0 and 100.
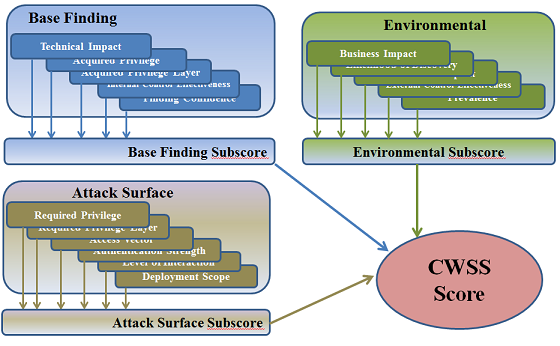
Figure 2: CWSS Scoring
1.3.2 Scoring Methods within CWSS
The stakeholder community is collaborating with MITRE to
investigate several different scoring methods that might need to be
supported within the CWSS framework.
| Method | Notes |
|---|
|
Targeted
|
Score individual weaknesses that are discovered in the design or
implementation of a specific ("targeted") software package,
e.g. a buffer overflow in the username of an authentication routine in
line 1234 of server.c in an FTP server package.
Automated tools and software security consultants use targeted
methods when evaluating the security of a software package in terms of
the weaknesses that are contained within the package.
|
|
Generalized
|
Score classes of weaknesses independent of any particular software
package, in order to prioritize them relative to each other
(e.g. "buffer overflows are higher priority than memory
leaks"). This approach is used by the CWE/SANS Top 25, OWASP Top
Ten, and similar efforts, but also by some automated code
scanners.
The generalized scores could vary significantly from the targeted
scores that would result from a full analysis of the individual
occurrences of the weakness class within a specific software package.
For example, while the class of buffer overflows remains very
important to many developers, individual buffer overflow bugs might be
considered less important if they cannot be directly triggered by an
attacker and their impact is reduced due to OS-level protection
mechanisms such as ASLR.
|
|
Context-adjusted
|
Modify scores in accordance with the needs of a specific analytical
context that may integrate business/mission priorities, threat
environments, risk tolerance, etc. These needs are captured
using vignettes that link inherent
characteristics of weaknesses with higher-level business
considerations. This method could be applied to both targeted and
generalized scoring.
|
|
Aggregated
|
Combine the results of multiple, lower-level weakness scores to
produce a single, overall score (or "grade"). While
aggregation might be most applicable to the targeted method, it could
also be used in generalized scoring, as occurred in the 2010 CWE/SANS
Top 25.
|
Note that the current focus for CWSS is on the Targeted scoring
method and a framework for context-adjusted scoring. Methods for
aggregated scoring will follow. Generalized scoring is being
developed separately, primarily as part of the 2011 Top 25 and
CWRAF.
1.4 Who performs the scoring?
CWSS scores can be automatically calculated, e.g. by a code analysis
tool, or they can be manually calculated by a software security
consultant or developer. Since automated analysis is not likely to
have certain information available - such as the application's
operating environment - CWSS scoring could possibly be conducted in
multiple rounds: a tool first automatically calculates CWSS scores,
then a human analyst manually adds additional details and recalculates
the scores.
1.5 Who owns CWSS?
CWSS is a part of the Common Weakness Enumeration (CWE) project,
co-sponsored by the Software Assurance program in the office of
Cybersecurity and Communications of the U.S. Department of Homeland
Security (DHS).
1.6 Who is using CWSS?
To be most effective, CWSS supports multiple usage scenarios by
different stakeholders who all have an interest in a consistent
scoring system for prioritizing software weaknesses that could
introduce risks to products, systems, networks and services. Some of
the primary stakeholders are listed below.
| Stakeholder | Description |
|---|
|
Software developers
|
Developers often operate within
limited time frames, due to release cycles and limited resources. As
a result, they are unable to investigate and fix every reported
weakness. They may choose to concentrate on the worst problems, the
easiest-to-fix. In the case of automatic weakness findings, they
might choose to focus on the findings that are least likely to be
false positives.
|
|
Software development managers
|
Development managers create strategies for
prioritizing and removing entire classes of weaknesses from the entire
code base, or at least the portion that is deemed to be most at risk,
possibly by defining custom "Top-N" lists. They must understand the
security implications of integrating third-party software, which may
contain its own weaknesses. They may need to support distinct
security requirements and prioritization for each product line.
|
|
Software acquirers
|
Customers, including acquisition personnel, want to obtain
third-party software with a reasonable level of assurance that the
software provider has performed due diligence in removing or avoiding
weaknesses that are most critical to the acquirer's business and
mission. Related stakeholders include CIOs, CSOs, system
administrators, and end users of the software.
|
|
Enterprise security managers
|
Enterprise security managers seek to minimize risk within their
enterprise, both for well-known vulnerabilities in third-party
products, as well as vulnerabilities (or weaknesses) in their own
in-house software. They may wish to use a scoring mechanism that can
be integrated with other security management processes, such as
combining third-party vulnerability scanning results (for known
third-party vulnerabilities) with custom application analysis (for
in-house software) to help assess the overall risk to an asset.
|
|
Code analysis vendors and consultants
|
Vendors and consultants often have their own custom scoring
techniques, but they want to provide a consistent, community-vetted
scoring mechanism for different customers.
|
|
Evaluators of code analysis capabilities
|
Evaluators analyze and measure the
capabilities of code analysis techniques (e.g., NIST SAMATE). They
could use a consistent weakness scoring mechanism to support sampling
of reported findings, as well as understanding the severity of these
findings without depending on ad hoc scoring methods that may vary
widely by tool/technique.
|
|
Other stakeholders
|
Other stakeholders may include
vulnerability researchers, advocates of secure development, and
compliance-based analysts (e.g., PCI DSS).
|
As of July 2014 (when CWSS 0.8 was active), there are several
real-world implementations of CWSS. The primary users have been code
analysis vendors and software security consultants.
(2) Metric Groups
2.1 Metric Group Factors
CWSS contains the following factors, organized based on their metric
group:
| Group | Name | Summary |
|---|
|
Base Finding
| Technical Impact (TI) |
The potential result that can be produced by the weakness,
assuming that the weakness can be successfully reached and
exploited. |
|
Base Finding |
Acquired Privilege (AP) |
The type of privileges that are obtained by an attacker who can
successfully exploit the weakness. |
|
Base Finding |
Acquired Privilege Layer (AL) |
The operational layer to which the attacker gains privileges by
successfully exploiting the weakness. |
|
Base Finding |
Internal Control Effectiveness (IC) |
the ability of the control to render the weakness unable to be
exploited by an attacker. |
|
Base Finding |
Finding Confidence (FC) |
the confidence that the reported issue is a weakness that can be
utilized by an attacker |
|
Attack Surface |
Required Privilege (RP) |
The type of privileges that an attacker must already have in order to reach
the code/functionality that contains the weakness. |
|
Attack Surface |
Required Privilege Layer (RL) |
The operational layer to which the attacker must have privileges
in order to attempt to attack the weakness. |
|
Attack Surface |
Access Vector (AV) |
The channel through which an attacker must communicate to reach the
code or functionality that contains the weakness. |
|
Attack Surface |
Authentication Strength (AS) |
The strength of the authentication routine that protects the
code/functionality that contains the weakness. |
|
Attack Surface |
Level of Interaction (IN) |
the actions that are required by the human victim(s) to enable a
successful attack to take place. |
|
Attack Surface |
Deployment Scope (SC) |
Whether the weakness is present in all deployable instances of the
software, or if it is limited to a subset of platforms and/or configurations. |
|
Environmental |
Business Impact (BI) |
The potential impact to the business or mission if the weakness
can be successfully exploited. |
|
Environmental |
Likelihood of Discovery (DI) |
The likelihood that an attacker can discover the weakness |
|
Environmental |
Likelihood of Exploit (EX) |
the likelihood that, if the weakness is discovered, an attacker
with the required privileges/authentication/access would be able to
successfully exploit it. |
|
Environmental |
External Control Effectiveness (EC) |
the capability of controls or mitigations outside of the software
that may render the weakness more difficult for an attacker to reach
and/or trigger. |
|
Environmental |
Prevalence (P) |
How frequently this type of weakness appears in software. |
Each factor is described in more detail in subsequent sections.
2.2 Values for Uncertainty and Flexibility
CWSS can be used in cases where there is little information at
first, but the quality of information can improve over time. It is
anticipated that in many use-cases, the CWSS score for an individual
weakness finding may change frequently, as more information is
discovered. Different entities may determine separate factors at
different points in time.
As such, every CWSS factor effectively has
"environmental" or "temporal" characteristics, so
it is not particularly useful to adopt the same types of metric groups
as are used in CVSS.
Most factors have these four values in common:
| Value | Usage |
|---|
|
Unknown
|
The entity calculating the score does not have enough information
to provide a value for the factor. This can be a signal for further
investigation. For example, an automated code scanner might be able
to find certain weaknesses, but be unable to detect whether any
authentication mechanisms are in place.
The use of "Unknown" emphasizes that the score is
incomplete or estimated, and further analysis may be necessary. This
makes it easier to model incomplete information, and for the Business
Value Context to influence final scores that were generated using
incomplete information.
The weight for this value is 0.5 for all factors, which generally
produces a lower score; the addition of new information (i.e.,
changing some factors from "Unknown" to another value) will
then adjust the score upward or downward based on the new
information.
|
|
Not Applicable
|
The factor is being explicitly ignored in the score calculation. This
effectively allows the Business Value Context to dictate whether a
factor is relevant to the final score. For example, a
customer-focused CWSS scoring method might ignore the remediation
effort, and a high-assurance environment might require investigation
of all reported findings, even if there is low confidence in their
accuracy.
For a set of weakness findings for an individual software package,
it is expected that all findings would have the same "Not
Applicable" value for the factor that is being ignored.
|
|
Quantified
|
The factor can be weighted using a quantified, continuous range of
0.0 through 1.0, instead of the factor's defined set of discrete
values. Not all factors are quantifiable in this way, but it allows
for additional customization of the metric.
|
|
Default
|
The factor's weight can be set to a default value. Labeling the
factor as a default allows for investigation and possible modification
at a later time.
|
2.3 Base Finding Metric Group
The Base Finding metric group consists of the following factors:
- Technical Impact (TI)
- Acquired Privilege (AP)
- Acquired Privilege Layer (AL)
- Internal Control Effectiveness (IC)
- Finding Confidence (FC)
The combination of values from Technical Impact, Acquired
Privilege, and Acquired Privilege Layer gives the user some expressive
power. For example, the user can characterize "High"
Technical Impact with "Administrator" privilege at the
"Application" layer.
2.3.1 Technical Impact (TI)
Technical Impact is the potential result that can be produced by
the weakness, assuming that the weakness can be successfully reached
and exploited. This is expressed in terms that are more fine-grained
than confidentiality, integrity, and availability.
The Technical Impact should be evaluated relative to the Acquired
Privilege (AP) and Acquired Privilege Layer (AL).
| Value | Code | Weight | Description |
|---|
|
Critical
|
C
|
1.0
|
Complete control over the software being analyzed, to the point where
operations cannot take place.
|
|
High
|
H
|
0.9
|
Significant control over the software being analyzed, or access
to critical information can be obtained.
|
|
Medium
|
M
|
0.6
|
Moderate control over the software being analyzed, or access to
moderately important information can be obtained.
|
|
Low
|
L
|
0.3
|
Minimal control over the software being analyzed, or only access to
relatively unimportant information can be obtained.
|
|
None
|
N
|
0.0
|
There is no technical impact to the software being analyzed at all.
In other words, this does not lead to a vulnerability.
|
|
Default
|
D
|
0.6
|
The Default weight is the median of the weights for Critical, High,
Medium, Low, and None.
|
|
Unknown
|
UK
|
0.5
|
There is not enough information to provide a value for this
factor. Further analysis may be necessary. In the future, a
different value might be chosen, which could affect the score.
|
|
Not Applicable
|
NA
|
1.0
|
This factor is being intentionally ignored in the score calculation
because it is not relevant to how the scorer prioritizes weaknesses.
This factor might not be applicable in an environment with high assurance
requirements; the user might want to investigate every weakness
finding of interest, regardless of confidence.
|
|
Quantified
|
Q
|
|
This factor could be quantified with custom weights.
|
If this set of values is not precise enough, CWSS users can use
their own Quantified methods to derive a subscore. One such method
involves using the Common Weakness Risk
Analysis Framework (CWRAF) to define a vignette and a Technical
Impact Scorecard. The Impact weight is
calculated using
vignette-specific Importance ratings for different technical impacts
that could arise from exploitation of the weakness, such as
modification of sensitive data, gaining privileges, resource
consumption, etc.
2.3.2 Acquired Privilege (AP)
The Acquired Privilege identifies the type of privileges that are
obtained by an attacker who can successfully exploit the weakness.
Notice that the values are the same as those for Required
Privilege, but the weights are different.
In some cases, the value for Acquired Privileges may be the same as
for Required Privileges, which implies either (1)
"horizontal" privilege escalation (e.g. from one
unprivileged user to another) or (2) privilege escalation within a
sandbox, such as an FTP-only user who can escape to the shell.
| Value | Code | Weight | Description |
|---|
|
Administrator
|
A
|
1.0
|
The attacker gains access to an entity with administrator, root,
SYSTEM, or equivalent privileges that imply full control over the
software under analysis; or, the attacker can raise their own (lower)
privileges to an administrator.
|
|
Partially-Privileged User
|
P
|
0.9
|
The attacker gains access to an entity with some special
privileges, but not enough privileges that are equivalent to an
administrator; or, the attacker can raise their own (lower) privileges
to a partially-privileged user. For example, a user might have
privileges to make backups, but not to modify the software's
configuration or install updates.
|
|
Regular User
|
RU
|
0.7
|
The attacker gains access to an entity that is a regular user who
has no special privileges; or, the attacker can raise their own
(lower) privileges to that of a regular user.
|
|
Limited / Guest
|
L
|
0.6
|
The attacker gains access to an entity with limited or
"guest" privileges that can significantly restrict allowable
activities; or, the attacker can raise their own (lower) privileges to
a guest. Note: this value does not refer to the "guest operating
system" concept in virtualized hosts.
|
|
None
|
N
|
0.1
|
The attacker cannot gain access to any extra privileges beyond
those that are already available to the attacker. (Note that this
value can be useful in limited circumstances in which the attacker can
escape a sandbox or other restrictive environment but still cannot
gain extra privileges, or obtain access as other users.)
|
|
Default
|
D
|
0.7
|
Median of the weights for None, Guest, Regular User,
Partially-Privileged User, and Administrator.
|
|
Unknown
|
UK
|
0.5
|
There is not enough information to provide a value for this
factor. Further analysis may be necessary. In the future, a
different value might be chosen, which could affect the score.
|
|
Not Applicable
|
NA
|
1.0
|
This factor is being intentionally ignored in the score calculation
because it is not relevant to how the scorer prioritizes weaknesses.
This factor might not be applicable in an environment with high
assurance requirements that wants strict enforcement of privilege
separation, even between already-privileged users.
|
|
Quantified
|
Q
|
|
This factor could be quantified with custom weights. Note that
Quantified values are supported for completeness; however, since
privileges and users are discrete entities, there might be limited
circumstances in which a quantified model would be useful.
|
2.3.3 Acquired Privilege Layer (AL)
The Acquired Privilege Layer identifies the operational layer to
which the attacker gains privileges by successfully exploiting the
weakness.
| Value | Code | Weight | Description |
|---|
|
Application
|
A
|
1.0
|
The attacker acquires privileges that are supported within the
software under analysis itself. (If the software under analysis is an
essential part of the underlying system, such as an operating system
kernel, then the System value may be more appropriate.)
|
|
System
|
S
|
0.9
|
The attacker acquires privileges to the underlying system or
physical host that is being used to run the software under
analysis.
|
|
Network
|
N
|
0.7
|
The attacker acquires privileges to access the network.
|
|
Enterprise
Infrastructure
|
E
|
1.0
|
The attacker acquires privileges to a critical piece of enterprise
infrastructure, such as a router, switch, DNS, domain controller,
firewall, identity server, etc.
|
|
Default
|
D
|
0.9
|
Median of the weights for Application, System, Network, and
Enterprise Infrastructure.
|
|
Unknown
|
UK
|
0.5
|
There is not enough information to provide a value for this
factor. Further analysis may be necessary. In the future, a
different value might be chosen, which could affect the score.
|
|
Not Applicable
|
NA
|
1.0
|
This factor is being intentionally ignored in the score calculation
because it is not relevant to how the scorer prioritizes weaknesses.
This factor might not be applicable in an environment with high
assurance requirements that wants strict enforcement of privilege
separation, even between already-privileged users.
|
|
Quantified
|
Q
|
|
This factor could be quantified with custom weights. Note that
Quantified values are supported for completeness; however, since
privilege layers are discrete entities, there might be limited
circumstances in which a quantified model would be useful.
|
2.3.4 Internal Control Effectiveness (IC)
An Internal Control is a control, protection mechanism, or
mitigation that has been explicitly built into the software (whether
through architecture, design, or implementation). Internal Control
Effectiveness measures the ability of the control to render the
weakness unable to be exploited by an attacker. For example, an input
validation routine that restricts input length to 15 characters might
be moderately effective against XSS attacks by reducing the size of
the XSS exploit that can be attempted.
When there are multiple internal controls, or multiple code paths
that can reach the same weakness, then the following guidance
applies:
- For each code path, analyze each internal control that exists
along the code path, and choose the Value with the lowest weight
(i.e., the strongest internal control along the code path). This
is called the Code Path Value.
- Collect all Code Path Values.
- Select the Code Path Value that has the highest weight (i.e., is
the weakest control).
This method evaluates each code path in terms of the code path's
strongest control (since an attacker would have to bypass that
control), then selects the weakest code path (i.e., the easiest
route for the attacker to take).
| Value | Code | Weight | Description |
|---|
|
None
|
N
|
1.0
|
No controls exist.
|
|
Limited
|
L
|
0.9
|
There are simplistic methods or accidental restrictions that might
prevent a casual attacker from exploiting the issue.
|
|
Moderate
|
M
|
0.7
|
The protection mechanism is commonly used but has known limitations
that might be bypassed with some effort by a knowledgeable attacker.
For example, the use of HTML entity encoding to prevent XSS attacks
may be bypassed when the output is placed into another context such as
a Cascading Style Sheet or HTML tag attribute.
|
|
Indirect (Defense-in-Depth)
|
I
|
0.5
|
The control does not specifically protect against exploitation of the
weakness, but it indirectly reduces the impact when a successful
attack is launched, or otherwise makes it more difficult to construct
a functional exploit. For example, a validation routine might
indirectly limit the size of an input, which might make it difficult
for an attacker to construct a payload for an XSS or SQL injection
attack.
|
|
Best-Available
|
B
|
0.3
|
The control follows best current practices, although it may have some
limitations that can be overcome by a skilled, determined attacker,
possibly requiring the presence of other weaknesses. For example, the
double-submit method for CSRF protection is considered one of the
strongest available, but it can be defeated in conjunction with
behaviors of certain functionality that can read raw HTTP headers.
|
|
Complete
|
C
|
0.0
|
The control is completely effective against the weakness, i.e., there
is no bug or vulnerability, and no adverse consequence of exploiting
the issue. For example, a buffer copy operation that ensures that the
destination buffer is always larger than the source (plus any indirect
expansion of the original source size) will not cause an overflow.
|
|
Default
|
D
|
0.6
|
Median of the weights for Complete, Best-Available, Indirect,
Moderate, Limited, and None.
|
|
Unknown
|
UK
|
0.5
|
There is not enough information to provide a value for this
factor. Further analysis may be necessary. In the future, a
different value might be chosen, which could affect the score.
|
|
Not Applicable
|
NA
|
1.0
|
This factor is being intentionally ignored in the score calculation
because it is not relevant to how the scorer prioritizes weaknesses.
|
|
Quantified
|
Q
|
|
This factor could be quantified with custom weights.
|
2.3.5 Finding Confidence (FC)
Finding Confidence is the confidence that the reported issue:
- is a weakness, and
- can be triggered or utilized by an attacker
| Value | Code | Weight | Description |
|---|
|
Proven True
|
T
|
1.0
|
The weakness is reachable by the attacker.
|
|
Proven Locally True
|
LT
|
0.8
|
The weakness occurs within an individual function or component whose
design relies on safe invocation of that function, but attacker
reachability to that function is unknown or not present. For example,
a utility function might construct a database query without encoding
its inputs, but if it is only called with constant strings, the
finding is locally true.
|
|
Proven False
|
F
|
0.0
|
The finding is erroneous (i.e. the finding is a false positive and
there is no weakness), and/or there is no possible attacker role.
|
|
Default
|
D
|
0.8
|
Median of the weights for Proven True, Proven Locally True, and Proven
False.
|
|
Unknown
|
UK
|
0.5
|
There is not enough information to provide a value for this
factor. Further analysis may be necessary. In the future, a
different value might be chosen, which could affect the score.
|
|
Not Applicable
|
NA
|
1.0
|
This factor is being intentionally ignored in the score calculation
because it is not relevant to how the scorer prioritizes weaknesses.
This factor might not be applicable in an environment with high assurance
requirements; the user might want to investigate every weakness
finding of interest, regardless of confidence.
|
|
Quantified
|
Q
|
|
This factor could be quantified with custom weights. Some code
analysis tools have precise measurements of the accuracy of specific
detection patterns.
|
2.4 Attack Surface Metric Group
The Attack Surface metric group consists of the following factors:
- Required Privilege (RP)
- Required Privilege Layer (RL)
- Access Vector (AV)
- Authentication Strength (AS)
- Level of Interaction (IN)
- Deployment Scope (SC)
2.4.1 Required Privilege (RP)
The Required Privilege identifies the type of privileges that an
attacker must already have in order to reach the code/functionality
that contains the weakness.
| Value | Code | Weight | Description |
|---|
|
None
|
N
|
1.0
|
No privileges are required. For example, a web-based search engine
may not require any privileges for an entity to enter a search term
and view results.
|
|
Limited / Guest
|
L
|
0.9
|
The entity has limited or "guest" privileges that can
significantly restrict allowed activities; the entity might be able to
register or create a new account without any special requirements or
proof of identity. For example, a web blog might allow participants
to create a user name and submit a valid email address before entering
comments. Note: this value does not refer to the "guest operating
system" concept in virtualized hosts.
|
|
Regular User
|
RU
|
0.7
|
The entity is a regular user who has no special privileges.
|
|
Partially-Privileged User
|
P
|
0.6
|
The entity is a valid user with some special privileges, but not
enough privileges that are equivalent to an administrator. For
example, a user might have privileges to make backups, but not to
modify the software's configuration or install updates.
|
|
Administrator
|
A
|
0.1
|
The entity has administrator, root, SYSTEM, or equivalent privileges
that imply full control over the software or the underlying OS.
|
|
Default
|
D
|
0.7
|
Median of the weights for None, Limited, Regular User,
Partially-Privileged User, and Administrator.
|
|
Unknown
|
UK
|
0.5
|
There is not enough information to provide a value for this
factor. Further analysis may be necessary. In the future, a
different value might be chosen, which could affect the score.
|
|
Not Applicable
|
NA
|
1.0
|
This factor is being intentionally ignored in the score calculation
because it is not relevant to how the scorer prioritizes weaknesses.
This factor might not be applicable in an environment with high assurance
requirements that wants strict enforcement of privilege separation,
even between already-privileged users.
|
|
Quantified
|
Q
|
|
This factor could be quantified with custom weights. Note that
Quantified values are supported for completeness; however, since
privileges and users are discrete entities, there might be limited
circumstances in which a quantified model would be useful.
|
2.4.2 Required Privilege Layer (RL)
The Required Privilege Layer identifies the operational layer to
which the attacker must have privileges in order to attempt to attack
the weakness.
| Value | Code | Weight | Description |
|---|
|
Application
|
A
|
1.0
|
The attacker must have privileges that are supported within the
software under analysis itself. (If the software under analysis is an
essential part of the underlying system, such as an operating system
kernel, then the System value may be more appropriate.)
|
|
System
|
S
|
0.9
|
The attacker must have privileges to the underlying system or
physical host that is being used to run the software under
analysis.
|
|
Network
|
N
|
0.7
|
The attacker must have privileges to access the network.
|
|
Enterprise
Infrastructure
|
E
|
1.0
|
The attacker must have privileges on a critical piece of enterprise
infrastructure, such as a router, switch, DNS, domain controller,
firewall, identity server, etc.
|
|
Default
|
D
|
0.9
|
Median of the weights for Application, System, Network, and
Enterprise Infrastructure.
|
|
Unknown
|
UK
|
0.5
|
There is not enough information to provide a value for this
factor. Further analysis may be necessary. In the future, a
different value might be chosen, which could affect the score.
|
|
Not Applicable
|
NA
|
1.0
|
This factor is being intentionally ignored in the score calculation
because it is not relevant to how the scorer prioritizes weaknesses.
This factor might not be applicable in an environment with high assurance
requirements that wants strict enforcement of privilege separation,
even between already-privileged users.
|
|
Quantified
|
Q
|
|
This factor could be quantified with custom weights. Note that
Quantified values are supported for completeness; however, since
privilege layers are discrete entities, there might be limited
circumstances in which a quantified model would be useful.
|
2.4.3 Access Vector (AV)
The Access Vector identifies the channel through which an attacker
must communicate to reach the code or functionality that contains the
weakness. Note that these values are very similar to the ones used in
CVSS, except CWSS distinguishes between physical access and local
(shell/account) access.
While there is a close relationship between Access Vector and
Required Privilege Layer, the two are distinct. For example, an
attacker with "physical" access to a router might be able to
affect the Network or Enterprise layer.
| Value | Code | Weight | Description |
|---|
|
Internet
|
I
|
1.0
| An attacker must have access to the Internet to reach the
weakness.
|
|
Intranet
|
R
|
0.8
|
An attacker must have access to an enterprise intranet that is
shielded from direct access from the Internet, e.g. by using a
firewall, but otherwise the intranet is accessible to most members of
the enterprise.
|
|
Private Network
|
V
|
0.8
|
An attacker must have access to a private network that is only
accessible to a narrowly-defined set of trusted parties.
|
|
Adjacent Network
|
A
|
0.7
|
An attacker must have access to a physical interface to the network,
such as the broadcast or collision domain of the vulnerable software.
Examples of local networks include local IP subnet, Bluetooth, IEEE
802.11, and local Ethernet segment.
|
|
Local
|
L
|
0.5
|
The attacker must have an interactive, local (shell) account that
interfaces directly with the underlying operating system.
|
|
Physical
|
P
|
0.2
|
The attacker must have physical access to the system that the software
runs on, or otherwise able to interact with the system via interfaces
such as USB, CD, keyboard, mouse, etc.
|
|
Default
|
D
|
0.75
|
Median of weights for relevant values.
|
|
Unknown
|
U
|
0.5
|
|
|
Not Applicable
|
NA
|
1.0
|
This factor is being intentionally ignored in the score calculation
because it is not relevant to how the scorer prioritizes weaknesses.
|
|
Quantified
|
Q
|
|
This factor could be quantified with custom weights. Note that
Quantified values are supported for completeness; however, since
access vectors are discrete entities, there might be limited
circumstances in which a quantified model would be useful.
|
2.4.4 Authentication Strength (AS)
The Authentication Strength covers the strength of the
authentication routine that protects the code/functionality that
contains the weakness.
When there are multiple authentication routine, or multiple code
paths that can reach the same weakness, then the following guidance
applies:
- For each code path, analyze each authentication routine that
exists along the code path, and choose the Value with the lowest
weight (i.e., the strongest authentication routine along the code
path). This is called the Code Path Value.
- Collect all Code Path Values.
- Select the Code Path Value that has the highest weight (i.e.,
contains the weakest routine).
This method evaluates each code path in terms of the code path's
strongest authentication routine (since an attacker would have to
bypass that control), then selects the weakest code path (i.e., the
easiest route for the attacker to take).
| Value | Code | Weight | Description |
|---|
|
Strong
|
S
|
0.7
|
The weakness requires strongest-available methods to tie the entity to
a real-world identity, such as hardware-based tokens, and/or
multi-factor authentication.
|
|
Moderate
|
M
|
0.8
|
The weakness requires authentication using moderately strong methods,
such as the use of certificates from untrusted authorities,
knowledge-based authentication, or one-time passwords.
|
|
Weak
|
W
|
0.9
|
The weakness requires a simple, weak authentication method that is
easily compromised using spoofing, dictionary, or replay attacks, such
as a static password.
|
|
None
|
N
|
1.0
|
The weakness does not require any authentication at all.
|
|
Default
|
D
|
0.85
|
Median of values for Strong, Moderate, Weak, and None.
|
|
Unknown
|
UK
|
0.5
|
There is not enough information to provide a value for this
factor. Further analysis may be necessary. In the future, a
different value might be chosen, which could affect the score.
|
|
Not Applicable
|
NA
|
1.0
|
This factor is being intentionally ignored in the score calculation
because it is not relevant to how the scorer prioritizes weaknesses.
This might not be applicable in an environment with high assurance
requirements that seek to eliminate all weaknesses.
|
|
Quantified
|
Q
|
|
This factor could be quantified with custom weights.
|
2.4.5 Level of Interaction (IN)
The Level of Interaction covers the actions that are required by
the human victim(s) to enable a successful attack to take place.
| Value | Code | Weight | Description |
|---|
|
Automated
|
A
|
1.0
|
No human interaction is required.
|
|
Typical/Limited
|
T
|
0.9
| The attacker must convince the user to perform an action
that is common or regarded as "normal" within typical
product operation. For example, clicking on a link in a web page, or
previewing the body of an email, is common behavior.
|
|
Moderate
|
M
|
0.8
|
The attacker must convince the user to perform an action that might
appear suspicious to a cautious, knowledgeable user. For example: the
user has to accept a warning that suggests the attacker's payload
might contain dangerous content.
|
|
Opportunistic
|
O
|
0.3
|
The attacker cannot directly control or influence the victim, and can
only passively capitalize on mistakes or actions of others.
|
|
High
|
H
|
0.1
|
A large amount of social engineering is required, possibly including
ignorance or negligence on the part of the victim.
|
|
No interaction
|
NI
|
0.0
| There is no interaction possible, not even
opportunistically; this typically would render the weakness as a
"bug" instead of leading to a vulnerability. Since CWSS is
for security, the weight is 0.
|
|
Default
|
D
|
0.55
|
Median of values for Automated, Limited, Moderate, Opportunistic,
High, and No interaction.
|
|
Unknown
|
UK
|
0.5
|
There is not enough information to provide a value for this
factor. Further analysis may be necessary. In the future, a
different value might be chosen, which could affect the score.
|
|
Not Applicable
|
NA
|
1.0
|
This factor is being intentionally ignored in the score calculation
because it is not relevant to how the scorer prioritizes weaknesses.
This might not be applicable in an environment with high assurance
requirements, or an environment that has high concerns about insider
attacks between people with an established trust relationship.
|
|
Quantified
|
Q
|
|
This factor could be quantified with custom weights.
|
2.4.6 Deployment Scope (SC)
Deployment Scope identifies whether the weakness is present in all
deployable instances of the software, or if it is limited to a subset
of platforms and/or configurations. For example, a numeric
calculation error might only be applicable for software that is
running under a particular OS and a 64-bit architecture, or a path
traversal issue might only affect operating systems for which
"\" is treated as a directory separator.
| Value | Code | Weight | Description |
|---|
|
All
|
A
|
1.0
|
Present in all platforms or configurations
|
|
Moderate
|
M
|
0.9
|
Present in common platforms or configurations
|
|
Rare
|
R
|
0.5
|
Only present in rare platforms or configurations
|
|
Potentially Reachable
|
P
|
0.1
| Potentially reachable,
but all code paths are currently safe, and/or the weakness is in dead
code
|
|
Default
|
D
|
0.7
|
The median of weights for RAMP values
|
|
Unknown
|
UK
|
0.5
|
There is not enough information to provide a value for this
factor. Further analysis may be necessary. In the future, a
different value might be chosen, which could affect the score.
|
|
Not Applicable
|
NA
|
1.0
|
This factor is being intentionally ignored in the score calculation
because it is not relevant to how the scorer prioritizes weaknesses.
|
|
Quantified
|
Q
|
|
This factor could be quantified with custom weights. The user may
know what percentage of shipped (or supported) software contains this
bug.
|
2.5 Environmental Metric Group
The Environmental metric group consists of the following factors:
- Business Impact (BI)
- Likelihood of Discovery (DI)
- Likelihood of Exploit (EX)
- External Control Effectiveness (EC)
- Prevalence (P)
2.5.1 Business Impact (BI)
Business Impact describes the potential impact to the business or
mission if the weakness can be successfully
exploited.
| Value | Code | Weight | Description |
|---|
|
Critical
|
C
|
1.0
|
The business/mission could fail.
|
|
High
|
H
|
0.9
|
The operations of the business/mission would be significantly
affected.
|
|
Medium
|
M
|
0.6
|
The business/mission would be affected, but without extensive damage
to regular operations.
|
|
Low
|
L
|
0.3
|
Minimal impact on the business/mission.
|
|
None
|
N
|
0.0
|
No impact.
|
|
Default
|
D
|
0.6
|
The median of weights for Critical, High, Medium, Low, and None.
|
|
Unknown
|
UK
|
0.5
|
There is not enough information to provide a value for this
factor. Further analysis may be necessary. In the future, a
different value might be chosen, which could affect the score.
|
|
Not Applicable
|
NA
|
1.0
|
This factor is being intentionally ignored in the score calculation
because it is not relevant to how the scorer prioritizes weaknesses.
This factor might not be applicable in contexts in which the business
impact is irrelevant, or if the impact is being assessed and
considered in analytical processes that are outside of the CWSS score
itself.
|
|
Quantified
|
Q
|
|
This factor could be quantified with custom weights. Some
organizations might have specific measurements for the business value
of the asset, for example, which could be integrated into this
measurement.
|
2.5.2 Likelihood of Discovery (DI)
Likelihood of Discovery* is the likelihood that an attacker can
discover the weakness.
| Value | Code | Weight | Description |
|---|
|
High
|
H
|
1.0
|
It is very likely that an attacker can discover the weakness quickly
and with little effort using simple techniques, without access to
source code or other artifacts that simplify weakness detection.
|
|
Medium
|
M
|
0.6
|
An attacker might be able to discover the weakness, but would require
certain skills to do so, possibly requiring source code access or
reverse engineering knowledge. It may require some time investment to
find the issue.
|
|
Low
|
L
|
0.2
|
An attacker is unlikely to discover the weakness without highly
specialized skills, access to source code (or its equivalent), and a
large time investment.
|
|
Default
|
D
|
0.6
|
The median of the High, Medium, and Low values.
|
|
Unknown
|
UK
|
0.5
|
There is not enough information to provide a value for this
factor. Further analysis may be necessary. In the future, a
different value might be chosen, which could affect the score.
|
|
Not Applicable
|
NA
|
1.0
|
This factor is being intentionally ignored in the score calculation
because it is not relevant to how the scorer prioritizes weaknesses.
This might not be applicable when the scorer assumes that all
weaknesses will be discovered by an attacker.
|
|
Quantified
|
Q
|
|
This factor could be quantified with custom weights.
|
2.5.3 Likelihood of Exploit (EX)
Likelihood of Exploit is the likelihood that, if the weakness is
discovered, an attacker with the required
privileges/authentication/access would be able to successfully exploit
it.
| Value | Code | Weight | Description |
|---|
|
High
|
H
|
1.0
|
It is highly likely that an attacker would target this weakness
successfully, with a reliable exploit that is easy to develop.
|
|
Medium
|
M
|
0.6
|
An attacker would probably target this weakness successfully, but the
chances of success might vary, or require multiple attempts to
succeed.
|
|
Low
|
L
|
0.2
|
An attacker probably would not target this weakness, or could have
very limited chances of success.
|
|
None
|
N
|
0.0
|
An attacker has no chance of success; i.e., the issue is a "bug"
because there is no attacker role, and no benefit to the attacker.
|
|
Default
|
D
|
0.6
|
Median of the High, Medium, and Low values. The "None" value is
ignored with the expectation that few weakness findings would be
scored using the value, and including it in the median calculation
would reduce the weight to a non-intuitive level.
|
|
Unknown
|
UK
|
0.5
|
There is not enough information to provide a value for this
factor. Further analysis may be necessary. In the future, a
different value might be chosen, which could affect the score.
|
|
Not Applicable
|
NA
|
1.0
|
This factor is being intentionally ignored in the score calculation
because it is not relevant to how the scorer prioritizes weaknesses.
For example, the scorer might want to assume that attackers could
exploit any weakness they can find, or be willing to invest
significant resources to work around any possible barriers to exploit
success.
|
|
Quantified
|
Q
|
|
This factor could be quantified with custom weights.
|
2.5.4 External Control Effectiveness (EC)
External Control Effectiveness is the capability of controls or
mitigations outside of the software that may render the weakness more
difficult for an attacker to reach and/or trigger. For example,
Address Space Layout Randomization (ASLR) and similar technologies
reduce, but do not eliminate, the chances of success for a buffer
overflow attack. However, ASLR is not directly instantiated within
the software itself.
When there are multiple external controls, or multiple code paths
that can reach the same weakness, then the following guidance
applies:
- For each code path, analyze each external control that exists
along the code path, and choose the Value with the lowest weight
(i.e., the strongest external control along the code path). This
is called the Code Path Value.
- Collect all Code Path Values.
- Select the Code Path Value that has the highest weight (i.e., is
the weakest control).
This method evaluates each code path in terms of the code path's
strongest control (since an attacker would have to bypass that
control), then selects the weakest code path (i.e., the easiest
route for the attacker to take).
| Value | Code | Weight | Description |
|---|
|
None
|
N
|
1.0
|
No controls exist.
|
|
Limited
|
L
|
0.9
|
There are simplistic methods or accidental restrictions that might
prevent a casual attacker from exploiting the issue.
|
|
Moderate
|
M
|
0.7
|
The protection mechanism is commonly used but has known
limitations that might be bypassed with some effort by a knowledgeable
attacker.
|
|
Indirect (Defense-in-Depth)
|
I
|
0.5
|
The control does not specifically protect against exploitation of
the weakness, but it indirectly reduces the impact when a successful
attack is launched, or otherwise makes it more difficult to construct
a functional exploit.
For example, Address Space Layout Randomization (ASLR) and similar
technologies reduce, but do not eliminate, the chances of success in a
buffer overflow attack. Since the response is typically to exit the
process, the result is still a denial of service.
|
|
Best-Available
|
B
|
0.3
|
The control follows best current practices, although it may have some
limitations that can be overcome by a skilled, determined attacker,
possibly requiring the presence of other weaknesses. For example,
Transport Layer Security (TLS) / SSL 3 are in operation throughout
much of the Web, and stronger methods generally are not available due
to compatibility issues.
|
|
Complete
|
C
|
0.1
|
The control is completely effective against the weakness, i.e.,
there is no bug or vulnerability, and no adverse consequence of
exploiting the issue. For example, a sandbox environment might
restrict file access operations to a single working directory, which
would protect against exploitation of path traversal.
A non-zero weight is used to reflect the possibility that the
external control could be accidentally removed in the future, e.g. if
the software's environment changes.
|
|
Default
|
D
|
0.6
|
The median of Complete, Best-Available, Indirect, Moderate,
Limited, and None.
|
|
Unknown
|
UK
|
0.5
|
There is not enough information to provide a value for this
factor. Further analysis may be necessary. In the future, a
different value might be chosen, which could affect the score.
|
|
Not Applicable
|
NA
|
1.0
|
This factor is being intentionally ignored in the score calculation
because it is not relevant to how the scorer prioritizes weaknesses.
|
|
Quantified
|
Q
|
|
This factor could be quantified with custom weights.
|
2.5.5 Prevalence (P)
The Prevalence* of a finding identifies how frequently this type of
weakness appears in software.
This factor is intended for use in Generalized scoring of classes
of weaknesses, such as the development of custom Top-N weakness
lists. When scoring an individual weakness finding in an
automated-scanning context, this factor is likely to use a "Not
Applicable" value.
| Value | Code | Weight** | Description |
|---|
|
Widespread
|
W
|
1.0
|
The weakness is found in most or all software in the associated
environment, and may occur multiple times within the same software
package.
|
|
High
|
H
|
0.9
|
The weakness is encountered very often, but it is not
widespread.
|
|
Common
|
C
|
0.8
|
The weakness is encountered periodically.
|
|
Limited
|
L
|
0.7
|
The weakness is encountered rarely, or never.
|
|
Default
|
D
|
0.85
|
The median of Limited, Common, High, and Widespread.
|
|
Unknown
|
UK
|
0.5
|
There is not enough information to provide a value for this
factor. Further analysis may be necessary. In the future, a
different value might be chosen, which could affect the score.
|
|
Not Applicable
|
NA
|
1.0
|
This factor is being intentionally ignored in the score calculation
because it is not relevant to how the scorer prioritizes weaknesses.
When performing targeted scoring against specific weakness findings in
an application, Prevalence is normally expected to be irrelevant,
since the individual application and the analytical techniques
determine how frequently the weakness occurs, and many aggregated
scoring methods will generate larger scores if there are more
weaknesses.
|
|
Quantified
|
Q
|
|
This factor could be quantified with custom weights. Precise
prevalence data may be available within limited use cases, provided
the user is tracking weakness data at a low level of granularity. For
example, a developer may be tracking weaknesses across a suite of
products, or a code-auditing vendor could measure prevalence from the
software analyzed across the entire customer base. In a previous
version of CWSS, prevalence was calculated based on from raw voting
data that was collected for the 2010 Top 25, which used discrete
values (range 1 to 4) which were then adjusted to a 1-to-10 range.
|
(3) CWSS Score Formula
A CWSS 1.0 score can range between 0 and 100. It is calculated as
follows:
BaseFindingSubscore * AttackSurfaceSubscore *
EnvironmentSubscore
The BaseFindingSubscore supports values between 0 and 100. Both
the AttackSurfaceSubscore and EnvironmentSubscore support values
between 0 and 1.
3.1 Base Finding Subscore
The Base Finding subscore (BaseFindingSubscore) is calculated as
follows:
Base = [ (10 * TechnicalImpact + 5*(AcquiredPrivilege + AcquiredPrivilegeLayer) + 5*FindingConfidence) * f(TechnicalImpact) *
InternalControlEffectiveness ] * 4.0
f(TechnicalImpact) = 0 if TechnicalImpact = 0; otherwise f(TechnicalImpact) = 1.
The maximum potential BaseFindingSubscore is 100.
The definition of f(TechnicalImpact) has an equivalent in CVSS. It
is used to ensure that if the Technical Impact is 0, that the other
added factors do not inadvertently generate a non-zero score.
TechnicalImpact and the AcquiredPrivilege/AcquiredPrivilegeLayer
combination are given equal weight, each accounting for 40% of the
BaseFindingSubscore. (Each generate a sub-value with a maximum of
10). There is some adjustment for Finding Confidence, which accounts
for 20% of the Base (maximum of 5). The InternalControlEffectiveness
can adjust the score downward, perhaps to 0, depending on the strength
of any internal controls that have been applied to the issue. After
application of InternalControlEffectiveness, the possible range of
results is between 0 and 25, so the 4.0 coefficient is used to adjust
the BaseFindingSubscore to a range between 0 and 100.
3.2 Attack Surface Subscore
The AttackSurfaceSubscore is calculated as:
[ 20*(RequiredPrivilege + RequiredPrivilegeLayer + AccessVector) + 20*DeploymentScope + 15*LevelOfInteraction + 5*AuthenticationStrength ] / 100.0
The combination of required privileges / access makes up 60% of the
Attack Surface subscore; deployment scope, another 20%; interaction,
15%; and authentication, 5%. The authentication requirements are not
given much focus, under the assumption that strong proof of identity
will not significantly deter an attacker from attempting to exploit
the vulnerability.
This generates a range of values between 0 and 100, which are then
divided by 100.
3.3 Environmental Subscore
The EnvironmentalSubscore is calculated as:
[ (10*BusinessImpact + 3*LikelihoodOfDiscovery + 4*LikelihoodOfExploit + 3*Prevalence) *
f(BusinessImpact) * ExternalControlEffectiveness ] / 20.0
f(BusinessImpact) = 0 if BusinessImpact == 0; otherwise f(BusinessImpact) = 1
BusinessImpact accounts for 50% of the environmental score, and it
can move the final score to 0. ExternalControlEffectiveness is always
non-zero (to account for the risk that it can be inadvertently removed
if the environment changes), but otherwise it can have major impact on
the final score. The combination of LikelihoodOfDiscovery and
LikelihoodOfExploit accounts for 35% of the score, and Prevalence at
15%.
3.4 Additional Features of the Formula
There is significant diversity in the kinds of scores that can be
represented, although the use of multiplication of many different
factors, combined with multiple weights with small values, means that
the range of potential scores is somewhat skewed towards lower
values.
Since "Not Applicable" values have a weight of 1, the
formula always has a potential maximum score of 100.0. In extremely
rare cases in which certain factors are treated as Not Applicable
(e.g., Technical Impact, Business Impact, and Internal Control
Effectiveness), then the minimum possible score could be non-zero.
When default values are used for a large number of factors for a
single score, using the median weights as defined in CWSS 1.0, the
scores will skew heavily to the low side. The median weight for a
factor does not necessarily reflect the most likely value that could
be used, so the selection of Default weights may be changed in future
versions. Ideally, the formula would have a property in which the use
of many default values produces a score that is relatively close to
50; the selection of non-default values would adjust the final score
upward or downward, thereby increasing precision.
The use of "Unknown" values also generally produces
scores that skew to the low side. This might be a useful feature,
since scores will be higher if they have more specific
information.
(4) CWSS Vectors, Scoring Examples, and Score Portability
Using the Codes as specified for each factor, a CWSS score can be
stored in a compact, machine-parsable, human-readable format that
provides the details for how the score was generated. This is very
similar to how CVSS
vectors are constructed.
Unlike CVSS, not all CWSS factors can be described symbolically
with discrete values. Any factor can be quantified with continuous
weights that override the originally-defined default discrete values,
using the "Q" value. When calculated
using CWRAF, the Impact factor is effectively an
expression of 32 separate Technical Impacts and layers, many of which
would not be applicable to a particular weakness. Treating each
impact as a separate factor would roughly double the number of factors
required to calculate a CWSS score. In addition, CWRAF's use of
Business Value Context (BVC) to adjust scores for business-specific
concerns also means that a CWSS score and its vector may appear to be
inconsistent if they are "transported" to other domains or
vignettes.
With this concern in mind, a CWSS 1.0 vector should
explicitly list the weights for each factor, even though it increases
the size of the vector representation.
The format of a single factor in a CWSS vector is:
FactorName:Value,Weight
For example, "P:NA,1.0" specifies a "Not
Applicable" value for Prevalence with a weight of 1.0. A
specifier of "AV:P,0.2" indicates the "Physical"
value for Access Vector with a weight of 0.2.
Factors are separated by forward slash characters, such as:
AV:I,1.0/RP:L,0.9/AS:N,1.0
which lists values and weights for "AV" (Access Vector),
"RP" (Required Privilege Level), and "AS"
(Authentication Strength).
If a CWSS vector is provided that does not list the actual weights for
a value, then an implementation should report a possible error
or inconsistency, try to infer the CWSS version based on the vector's
factors and values, re-calculate the CWSS score based on the inferred
version, and compare this to the original score. If the scores are
inconsistent, the implementation should report a possible error
or inconsistency.
4.1 Example: Business-critical application
Consider a reported weakness in which an application is the primary
source of income for a company, thus has critical business value. The
application allows arbitrary Internet users to sign up for an account
using only an email address. A user can then exploit the weakness to
obtain administrator privileges for the application, but the attack
cannot succeed until the administrator views a report of recent user
activities - a common occurrence. The attacker cannot take complete
control over the application, but can delete its users and data.
Suppose further that there are no controls to prevent the weakness,
but the fix for the issue is simple, and limited to a few lines of
code.
This situation could be captured in the following CWSS vector:
(TI:H,0.9/AP:A,1.0/AL:A,1.0/IC:N,1.0/FC:T,1.0/
RP:L,0.9/RL:A,1.0/AV:I,1.0/AS:N,1.0/IN:T,0.9/SC:A,1.0/
BI:C,0.9/DI:H,1.0/EX:H,1.0/EC:N,1.0/P:NA,1.0)
The vector has been split into multiple lines for readability.
Each line represents a metric group.
The factors and values are as follows:
| Factor | Value |
|---|
|
Technical Impact
|
High
|
|
Acquired Privilege
|
Administrator
|
|
Acquired Privilege Layer
|
Application
|
|
Internal Control Effectiveness
|
None
|
|
Finding Confidence
|
Proven True
|
|
Required Privilege
|
Guest
|
|
Required Privilege Layer
|
Application
|
|
Access Vector
|
Internet
|
|
Authentication Strength
|
None
|
|
Level of Interaction
|
Typical/Limited
|
|
Deployment Scope
|
All
|
|
Business Impact
|
Critical
|
|
Likelihood of Discovery
|
High
|
|
Likelihood of Exploit
|
High
|
|
External Control Effectiveness
|
None
|
|
Prevalence
|
Not Applicable
|
The CWSS score for this vector is 92.6, derived as
follows:
- BaseSubscore:
- [ (10 * TI + 5*(AP + AL) + 5*FC) * f(TI) * IC ] * 4.0
- f(TI) = 1
- = [ (10 * 0.9 + 5*(1.0 + 1.0) + 5*1.0) * 1 * 1.0 ] * 4.0
- = [ (9.0 + 10.0 + 5.0) * 1.0 ] * 4.0
- = 24.0 * 4.0
- = 96.0
- AttackSurfaceSubscore:
- [ 20*(RP + RL + AV) + 20*SC + 15*IN + 5*AS ] / 100.0
- = [ 20*(0.9 + 1.0 + 1.0) + 20*1.0 + 15*0.9 + 5*1.0 ] / 100.0
- = [ 58.0 + 20.0 + 13.5 + 5.0 ] / 100.0
- = 96.5 / 100.0
- = 0.965
- EnvironmentSubscore:
- [ (10*BI + 3*DI + 4*EX + 3*P) * f(BI) * EC ] / 20.0
- f(BI) = 1
- = [ (10*1.0 + 3*1.0 + 4*1.0 + 3*1.0) * 1 * 1.0 ] / 20.0
- = [ (10.0 + 3.0 + 4.0 + 3.0) * 1.0 ] / 20.0
- = 20.0 / 20.0
- = 1.0
The final score is:
96.0 * 0.965 * 1.0 = 92.64 == 92.6
4.2 Example: Wiki with limited business criticality
Consider this CWSS vector. Suppose the software is a wiki that is
used for tracking social events for a mid-size business. Some of the
most important characteristics are that there is medium technical
impact to an application administrator from a regular user of the
application, but the application is not business-critical, so the
overall business impact is low. Also note that most of the
environment factors are set to "Not Applicable."
(TI:M,0.6/AP:A,1.0/AL:A,1.0/IC:N,1.0/FC:T,1.0/
RP:RU,0.7/RL:A,1.0/AV:I,1.0/AS:W,0.9/IN:A,1.0/SC:NA,1.0/
BI:L,0.3/DI:NA,1.0/EX:NA,1.0/EC:N,1.0/RE:NA,1.0/P:NA,1.0)
The vector has been split into multiple lines for readability.
Each line represents a metric group.
The factors and values are as follows:
| Factor | Value |
|---|
|
Technical Impact
|
Medium
|
|
Acquired Privilege
|
Administrator
|
|
Acquired Privilege Layer
|
Application
|
|
Internal Control Effectiveness
|
None
|
|
Finding Confidence
|
Proven True
|
|
Required Privilege
|
Regular User
|
|
Required Privilege Layer
|
Application
|
|
Access Vector
|
Internet
|
|
Authentication Strength
|
Weak
|
|
Level of Interaction
|
Automated
|
|
Deployment Scope
|
Not Applicable
|
|
Business Impact
|
Low
|
|
Likelihood of Discovery
|
Not Applicable
|
|
Likelihood of Exploit
|
Not Applicable
|
|
External Control Effectiveness
|
None
|
|
Prevalence
|
Not Applicable
|
The CWSS score for this vector is 51.1, derived as follows:
- BaseSubscore:
- [ (10 * TI + 5*(AP + AL) + 5*FC) * f(TI) * IC ] * 4.0
- f(TI) = 1
- = [ (10 * 0.6 + 5*(1 + 1) + 5*1) * f(TI) * 1 ] * 4.0
- = 84.0
- AttackSurfaceSubscore:
- [ 20*(RP + RL + AV) + 20*SC + 15*IN + 5*AS ] / 100.0
- = [ 20*(0.7 + 1 + 1) + 20*1.0 + 15*1.0 + 5*0.9 ] / 100.0
- = [ 54.0 + 20.0 + 15.0 + 4.5 ] / 100.0
- = 93.5 / 100.0
- = 0.94 (0.935)
- EnvironmentSubscore:
- [ (10*BI + 3*DI + 4*EX + 3*P) * f(BI) * EC ] / 20.0
- f(BI) = 1
- = [ (10*0.3 + 3*1.0 + 4*1.0 + 3*1.0) * f(BI) * 1 ] / 20.0
- = [ (3.0 + 3.0 + 4.0 + 3.0) * 1.0 * 1.0 ] / 20.0
- = [ 13.0 * 1.0 ] / 20.0
- = 0.65
The final score is:
84.0 * 0.935 * 0.65 = 51.051 == 51.1
4.3 Other Approaches to CWSS Score Portability
Instead of recording each individual weight within a CWSS vector,
several other methods could be adopted.
One possibility is to extend the CWSS vectors to record additional
metadata that does not affect the score but reflects the version or
other important information. The metadata portion would not
necessarily need to capture weights, per se. For example, the CWSS
version could be recorded by using a "factor" name such as "V" along
with a value that represents the CWSS version, e.g. "V:1.1". This
would add approximately 4 bytes to each CWSS vector. However, if
the version is encoded within a vector, then the assigned weights
would no longer need to be recorded (except for Quantified values),
so the resulting vectors could be much shorter.
A different approach would be to attach metadata to a set of
generated CWSS scores (such as the Technical Impact Scorecard if
CWRAF is used), but it could be too easy for this metadata to become
detached from the scores/vectors. Quantified factors would still
need to be represented within a vector, since they could vary for
each weakness finding.
Another approach is that when CWSS scores are transferred from one
party to the other, then the receiving party could re-calculate the
scores from the given CWSS vectors, then compare the re-calculated
scores with the original scores. A difference in scores would
suggest that different mechanisms are in use between the provider
and receiverd, possibly a different CWSS version.
(5) Considerations for CWSS beyond 1.0
For future versions, the following should be considered.
5.1 Current Limitations of the Scoring Method
5.1.1 Score Weight and Distribution
The formula still needs to be refined to ensure that the range of
potential scores is more evenly distibuted. There are probably
unexpected interactions between factors that must be identified and
resolved. CVSS scoring contains built-in adjustments that prevent
many factors from affecting the score too much, while also giving some
preference to impact over exploitability; similar built-in adjustments
may need to be performed for CWSS.
5.1.2 Raising the Priority of Design or Architectural Flaws
CWSS 1.0 does not provide any clear mechanism to give higher priority
to design or architecture flaws versus implementation vulnerabilities.
This can be an important distinction, because compromise of a design
flaw could potentially compromise the entire software package, but a
single CWSS score for such a design flaw could become "buried" if
there are many different implementation bugs. For example, a single
report of the lack of an input validation framework might be expected
to carry more weight than multiple individual XSS and SQL injection
bugs. This issue can be exacerbated if aggregated scores are used.
It might be possible to use the Business Impact factor, but this
factor might already be in use for its originally-intended purpose.
A "Weakness Scope" factor could be used to cover the
following scenario. Within CWSS 1.0, design and architecture flaws
receive the same relative priority as implementation issues, even
though they may lead to a complete compromise of the software. It may
be reasonable to use a separate factor in order to give
design/architecture flaws a larger weight, e.g. so that the lack of an
input validation framework (one "finding") can be given
higher priority than hundreds of individual findings for XSS or SQL
injection.
5.1.3 Compound Elements (Chains, Etc.)
There are also some challenges for scoring findings that combine
multiple weaknesses. By their nature, compound elements such as
chains and
composites involve interactions between multiple reported
weaknesses. With some detection techniques such as automated code
scanning, multiple CWE entries might be reported as separate findings
for a single chain or composite. If individual scores within each
link of the chain are counted separately, this could wind up
artificially inflating any aggregate scores. However, sometimes the
compound element is more than the sum of its parts, and the
combination of multiple weaknesses has a higher impact than the
maximum impact of any individual weakness. This is not well-handled
in the current CWSS scheme; however, it should be noted that CVSSv3 is
likely to include guidance for scoring chains as their own independent
entities, so future versions of CWSS might follow suit.
5.1.4 Other Types of Software Assessments
It is anticipated that CWSS may be considered for use in other
types of software assessments, such as safety, reliability, and
quality. Weaknesses or other issues related to code quality might
receive higher prioritization within a CWRAF vignette-oriented scheme,
since safety, compliance, or maintainability might be important. This
usage is not explicitly supported with CWSS 1.0. However, such
quality-related issues could be scored in which the Required Privilege
is the same as Acquired Privilege, and the Required Privilege Layer is
the same as the Acquired Privilege Layer; the Business Impact could
also be used.
5.2 Community Review and Validation of Factors
Pending community review, future versions of CWSS might modify,
remove, or add factors to the methodology.
As long as there are enough stakeholders or use-cases for whom a
factor is important, then it is a strong argument for keeping the
factor within CWSS, even if it is not essential for everyone. Others
could use the "Not Applicable" value when the factor is not
relevant to their own environment. However, the more factors in the
metric, the more complexity.
5.3 Impact of CWSS and CWE Version Changes to Scoring
The values for the factors involved in scoring could change
frequently based on industry trends. For example, the likelihood of
discovery of a particular weakness may change - rising if detection
techniques improve (or if there is a shift in focus because of
increases in attacks), or falling if enough developers have methods
for avoiding the weakness, and/or if automatic protection mechanisms
reach wide-scale adoption.
In the future, default values for some factors might be directly
obtained from CWE data. However, new CWE versions are released on a
regular basis, approximately 4 or 5 times a year. If a CWE entry is
modified in a way that affects CWSS-related factors, then the
resulting CWSS score for a weakness might differ depending on which
version of CWE is used. Theoretically, however, this could be
automatically detected by observing inconsistencies in the weights
used for "Default" values in CWSS vectors.
Because of these underlying changes, there is a significant risk
that CWSS scores will not be comparable across organizations or
assessments if they were calculated using different versions of CWSS,
vignettes, or CWE.
In anticipation of such changes, CWSS design should consider
including CWE and/or CWSS version numbers in the CWSS vector
representation (or associated metadata).
Finally, these changes should not occur too frequently, since each
change could cause CWSS scores to change unpredictably, causing
confusion and possibly interfering with strategic efforts to fix
weaknesses whose importance has suddenly been
reduced. Although this may be
inevitable for CWSS as a natural result of growth, the community
should attempt to prevent this from happening where possible.
While scores may change as CWSS and CWE evolve, there is not
necessarily a requirement for an organization to re-score whenever a
new version is released, especially if the organization is using CWSS
for internal purposes only. The variability of scores is largely a
problem for sharing scores between organizations. For example, a
software developer may have its own internally-defined vignettes and
BVC, so the developer may not have a need (or willingness) to share
CWSS scores outside the organization.
(6) Future Activities
After the release of CWSS 1.0, the schedule for future development
is uncertain. However, future plans might include:
- Continue to obtain stakeholder validation or feedback for the
existing factors, values, and weights. Now that CWSS is seeing
some real-world use, these stakeholders will have valuable input to
improve the metric.
- Continue to modify the scoring method and formula so that there is
less bias towards low scores, and incomplete or non-applicable data
does not adversely affect the scores.
- Refine and evaluate aggregated scoring techniques.
- Define a data exchange representation for CWSS scores and vectors,
e.g. XML/XSD.
-
The values for Authentication Strength (AS) might need to
be defined more clearly. It might be reasonable to adopt
approaches such as the four levels outlined in NIST Special
Publication
800-63
("Electronic Authentication Guideline") and
OMB
Memo 04-04. However, since the strength of an authentication
mechanism may degrade over time due to advances in attack techniques
or computing power, it might be useful to select values that are
effectively "future-proof." (On the other hand, this might
make it difficult to compare CWSS scores if they were assigned at
different times.)
-
It is not clear whether the SANE model of privilege layers is
sufficiently expressive or useful. Once CVSSv3 is released and
independently validated, CVSS' model should be revisited.
(7) Community Participation in CWSS
Currently, members of the software assurance community can
participate in the development of CWSS in the following ways:
- Provide feedback on this document.
- Review the factors that are currently defined; suggest
modifications to the current factors, and any additional factors
that would be useful.
- Evaluate the scoring formula and the relative importance of
factors within that formula.
- Define specific use cases for CWSS.
Appendix A: CVSS Comparison
A.1 CVSS Overview
The Common Vulnerability Scoring System (CVSS) is
commonly used when ranking vulnerabilities as they appear in deployed
software. CVSS provides a common framework for consistently scoring
vulnerabilities.
Conceptually, CVSS and CWSS are very similar. There are some
important strengths and limitations with CVSS, however.
One of CVSS' strengths lies in its simplicity. CVSS divides the
overall score into 14 separate characteristics within three metric
groups: Base, Temporal, and Environmental. Each characteristic is
decomposed into two or more distinct values. For example, the Access
Vector reflects the location from which an attacker must exploit a
vulnerability, with possible values of Local (authenticated to the
local system), Remote (across the network), or Network Adjacent (on
the same physical or logical network). Typically, in addition to the
CVSS score, a vector is provided that identifies the selected values
for each characteristic.
With the associated documentation, CVSS scoring is fairly
repeatable, i.e., different analysts will typically generate the same
score for a vulnerability. However, different scores can be generated
when information is incomplete, and significant variation is possible
if an analyst does not closely follow documentation. While the
simplified Confidentiality/Integrity/Availability model does not
provide the depth and flexibility desired by some security experts,
CVSS does provide the consistency that is useful for non-expert system
and network administrators for prioritizing vulnerabilities.
CVSS has been widely adopted, especially the use of base scores
from the Base metric group. Some organizations use the Temporal and
Environmental portions of CVSS, but this is relatively rare, so these
metric groups may not have been sufficiently vetted in the real
world.
A.2 Usage Scenarios for CWSS versus CVSS
The usage scenarios for CVSS differ from CWSS in the following ways:
- CVSS assumes that a vulnerability has already been discovered
and verified; CWSS can be applied earlier in the process, before
any vulnerabilities have been proven. CVSS is not scalable to the
security assessment of a single software package. A detailed
assessment, such as an automated code scan, may report thousands of
weakness findings. Because of the high volume, these findings often
need to be scored and prioritized before they can be more closely
examined to determine if they lead to vulnerabilities. CWSS
explicitly supports "unknown" values when there is incomplete
information.
- CVSS scoring does not account for incomplete information, but CWSS
scoring has built-in support for incomplete information. Within
CWSS, scoring may be necessary before the weakness is even known to
contribute to a vulnerability. For example, the scoring entity -
whether a human or machine - might not know the expected operating
environment or authentication requirements during initial CWSS
scoring. In CVSS, incomplete information is sometimes a problem
because many vulnerability reports do not contain all the relevant
details needed for scoring. When information is missing, a
conservative approach is to select values that will generate the
largest CVSS score. This approach is used by the National
Vulnerability Database and others, but it can artificially inflate
scores. Conservative scoring is viable, as long as most
vulnerability reports contain sufficient information. Within a
weakness-scoring context, a high percentage of weakness findings
will be missing a critical piece of information, since some
detection techniques will not be able to reliably determine if a
weakness can be exploited by an attacker without further analysis.
As a result, CWSS provides a way to explicitly record when
information is unavailable.
- CVSSv2 scoring has a large bias towards the impact on the
physical system; CWSS has a small bias in favor of the application
containing the weakness. In some contexts, users may strongly
prefer to score issues based on their impact to business-critical
data or functionality, which might have limited implications for the
impact to the overall physical system. For example, the maximum
possible score for CVSS is often 7.0 for Oracle products, since
these products typically run with limited privileges. CVSSv3 will
remove this bias toward the system, but its model still differs from
the model that CWSS uses.
Early CWSS development sought to preserve the strengths of CVSS
while also attempting to avoid some of the associated limitations.
A.3 Comparison of CVSSv2 Factors with CWSS Factors
Note that in CVSS, the Access Complexity (AC) value combines
multiple characteristics that are split into distinct factors within
CWSS, such as Required Privilege Level and Level of Interaction.
| CVSS | CWSS | Notes |
|---|
|
Confidentiality Impact (C),
Integrity Impact (I),
Availability Impact (A),
Security Requirements (CR, IR, AR),
Collateral Damage Potential (CDP)
|
Technical Impact
|
CWSS attempts to use a more fine-grained "Technical Impact"
model than confidentiality, integrity, and availability. Business
Value Context adjustments effectively encode the security requirements
from the Environmental portion of CVSS. The CDP is indirectly covered
within the BVC's linkage between business concerns and technical
impacts.
|
|
Access Complexity (AC), Target Distribution (TD)
|
Deployment Scope
|
Deployment Scope is indirectly covered by CVSS' Access Complexity,
which combines multiple distinct factors into a single item. It also
has an indirect association with Target Distribution (TD).
|
|
Access Vector (AV)
|
Access Vector
|
The values are similar, but CWSS distinguishes between physical access
and local (shell/account) access.
|
|
Access Complexity (AC)
|
Required Privilege Level
|
Required Privilege Level is indirectly covered by CVSS' Access
Complexity, which combines multiple distinct factors into a single
item.
|
|
N/A
|
Authentication Strength
|
This is not directly specified within CVSS, but scorers might consider
the authentication strength when evaluating Access Complexity (AC).
|
|
Authentication (Au)
|
Authentication Instances
|
|
|
N/A
|
Likelihood of Discovery
|
Within many CVSS use-cases, the vulnerability has already been
discovered and disclosed by another party when CVSS scoring takes
place. So there is no need to track the likelihood of discovery, as
the likelihood is (effectively) 1.0. However, within some CWSS
use-cases, the issue is only known to the developer at the time of
scoring, and the developer may choose to increase the priority of
issues that are most likely to be discovered.
|
|
N/A
|
Likelihood of Exploit
|
This is not covered in CVSS.
|
|
Access Complexity (AC)
|
Interaction Requirements
|
|
|
Access Complexity (AC), Remediation Level (RL)
|
Internal Control Effectiveness (IC)
|
The presence (or absence) of controls/mitigations may affect the CVSS
Access Complexity.
|
|
Access Complexity (AC)
|
External Control Effectiveness (EC)
|
The presence (or absence) of controls/mitigations may affect the CVSS
Access Complexity. However, a single CVE vulnerability could have
different CVSS scores based on vendor-specific configurations.
|
|
Report Confidence (RC)
|
Finding Confidence
|
|
|
N/A
|
Remediation Effort (RE)
|
|
|
Exploitability (E)
|
N/A
|
|
|
Target Distribution (TD)
|
N/A
|
There is no direct connection in CWSS 1.0 for target distribution;
there is no consideration of how many installations may be using the
software.
|
A.4 Other Differences between CVSS and CWSS
CWSS scores and CVSS scores are not necessarily comparable. Even
if CWSS scores (with a maximum of 100) are "normalized" to a CVSS
range by dividing by 10 (which would produce CVSS-equivalent scores
within the range of 0 to 10), this does not mean that a CWSS score
of 7 is equivalent to a CVSS 7. This might be a desirable feature
by some consumers, but since CWSS is often measuring completely
different characteristics than CVSS does, scoring equivalence might
not be feasible. In addition, in practice, CVSS scores do not
follow a regular distribution, generally with a skew towards high
scores; it is possible that CWSS might have better distribution.
Some organizations attempted to modify CVSS in order to address
some of the unique requirements of software security analysis; these
modifications are mentioned in Appendix B.
The metric groups in CWSS are different than those in CVSS, by
design. Some reviewers of early CWSS versions suggested that CWSS
adopt the same set of metric groups that are used by CVSS - Base,
Temporal, and Environmental. However, since CWSS scores can be
calculated in early, low-information scenarios, many factors are
"temporal" in nature, regardless of which group they are in;
also, these scores are likely to change as further analysis yields
more information about the weakness. CWSS supports the use of values
such as "Unknown" or "Default", which can be
filled in at a later time.
One aspect of CVSS that is not explicitly modeled in CWSS is the
notion of "partial" impacts. However, the acquired
privileges, privilege layer, technical impact, and business impact are
roughly equivalent, with more expressive power.
Appendix B: Other Scoring Methods
B.1 2008 CWSS Kickoff Meeting
In October 2008, a single-day kickoff meeting for CWSS was
held. Several participants described their scoring approaches:
Veracode reported an adaptation of CVSS to evaluate detected
weaknesses/vulnerabilities. Each issue is given weights for
Confidentiality, Integrity, and Availability, based on its associated
CWE entry. The weighting considers the average likely severity to
occur. For example, a buffer overflow could allow an attacker to
cause a crash, but it is not always exploitable for code
execution.
For aggregated scores, Veracode has several "VERAFIED Security
Marks" that are based on a calculated Security Quality Score
(SQS), which ranges from 0 to 100. The "VerAfied" security
mark is used to indicate software that Veracode has assessed to be
free of "very high," "high," or "medium"
severity vulnerabilities, and free of automatically-detectable
vulnerabilities from the CWE/SANS Top 25 or OWASP Top Ten. Two
"High Assurance" variations of the mark include a manual
assessment step that covers the remainder of the CWE/SANS Top 25 or
OWASP Top Ten that could not be identified by automatic detection.
The Veracode Rating System uses a three-letter rating system (with
grades of "A", "B", "C", "D",
and "F"). The first letter is used for the results from
binary analysis, the second for automated dynamic analysis, and the
third for human testing.
Cigital described a feasibility study of CVSSv2 with respect to
weaknesses. Some attributes such as "Target Distribution"
did not fit well. Other attributes were extended to add more
granularity. A polynomial scoring method was recommended. It was
also regarded as important to model the distinction between the
likelihood and the impact.
Cenzic provided details of the Hailstorm Application Risk Metric
(HARM). It is a quantitative score that is utilized by black box
analysis of web applications. The goal of the metric was to provide a
scalable approach to focus remediation efforts. The metric was split
into 4 impact areas relevant to web application security: the browser,
the session, the web application, and the server. The benefit to this
approach was that it was easily consumable.
CERT/SEI presented its approach to scoring the C Secure Coding
Rules. The FMECA metric, an ISO standard, was used. It characterizes
items in terms of Severity, Likelihood (of leading to a
vulnerability), and Remediation Cost.
B.2 2010 SANS/CWE Top 25
The 2010 SANS/CWE Top 25 Most Dangerous Software Errors list
attempted to perform quantitative prioritization of CWE entries using
a combination of Prevalence and Importance, which became the basis of
CWSS 0.1 later in the year. A survey approach was taken in which
respondents performed their own individual evaluation of Prevalence
and Importance for 41 candidate weaknesses, from which the final
scores were determined. To reflect the diverse opinions and use cases
of the respondents for the general Top 25 list, the Importance factor
was used instead of Impact. In an attempt to force consensus,
respondents were restricted to 4 selections of the highest value for
Importance ("Critical") and Prevalence
("Widespread"), although this forced choice was not popular;
it will probably be abandoned in future versions of the Top 25. Many
respondents used high-level rollup data, or a rough consensus of
opinion with the organization, sometimes covering multiple teams or
functions. Very few respondents had real-world data at the low level
of granularity used by the Top 25 (typically the "Base"
level of abstraction for CWE). An evaluation by PlexLogic later found
that the two variables were not entirely independent. This discovery
makes some sense, because the vulnerability research community tends
to focus on vulnerabilities/weaknesses with the highest impact. When
reliable attack techniques are devised for a particular
weakness/vulnerability, it becomes easier for more researchers to find
them, which can lead to widespread exploitation. Consequently, this
raises the relative Importance of a weakness.
The 2010 Top 25 was structured in a way to support multiple points
of view that could reflect different prioritizations of the
weaknesses. The creation of separate focus profiles stemmed from some
critiques of the original 2009 Top 25, in which a generalized Top 25
list would not necessarily be useful to all audiences, and that a
customized prioritization would be ideal. Eight focus profiles were
provided with the 2010 Top 25. For example, the Educational Emphasis
focus profile evaluated weaknesses that are regarded as important from
an educational perspective within a school or university context. It
emphasized the CWE entries that graduating students should know,
including weaknesses that were historically important or increased the
breadth of coverage. A separate focus profile ranked weaknesses based
solely on their evaluated Importance, which would be useful to
software customers who want the most serious issues removed, without
consideration for how frequently they occur or how resource-intensive
it is to fix. These ranking-oriented focus profiles made the Top 25
more useful to certain audiences, and their construction and
management have served as a useful predecessor to CWSS and
vignettes.
While the 2009 Top 25 did not rank items, several factors were
presented that were thought to be relevant to an audience: attack
frequency, impact or consequences, prevalence, and ease of detection.
Other considerations included remediation cost, amount of public
knowledge, and the likelihood that the weakness discovery would
increase in the future.
B.3 2010 OWASP Top Ten
In contrast to previous versions, the 2010 OWASP Top Ten shifted
focus from weaknesses/vulnerabilities to risks, which typically caused
each OWASP Top Ten entry to cover multiple related weakness types that
posed the same risk. Factors for prioritization included Ease of
Exploit, Prevalence, Detectability, and Technical Impact. Input from
contributors was solicited to determine the values for these factors,
but the final decision for each factor was made by the Top Ten
editorial staff based on trend information from several real-world
data sources. A metric was developed that used these factors to
prioritize the final Top Ten list.
B.4 Other Models
Microsoft's STRIDE model characterizes issues in terms of Spoofing
Identity, Tampering with Data, Repudiation, Information Disclosure,
Denial of Service, and Elevation of Privilege. The DREAD scheme
evaluates issues based on Damage Potential, Reproducibility of the
issue, Exploitability, Affected Users, and Discoverability. Many of
these attributes have equivalent factors in CWSS.
Appendix C: Design Considerations
For CWSS to be most effective to its stakeholders, several aspects
of the problem area were considered when designing the framework and
metrics.
- Flexibility: CWSS should be automatable and flexible
wherever possible, but support human input as well.
- Selected Automation: It is assumed that portions of CWSS
scores can be automatically generated. For example, some factors
may be dependent on the type of weakness being scored; potentially,
the resulting subscores could be derived from CWE data. As another
example, a web script might only be accessible by an administrator,
so all weaknesses may be interpreted in light of this required
privilege.
- Scalability: Some usage scenarios may require the scoring
of thousands of weaknesses, such as defect reports from an automated
code scanning tool. When such a high volume is encountered, there
are too many issues to analyze manually. As a result, automated
scoring must be supported.
- Stakeholder Analysis: The potential CWSS stakeholders,
their needs, and associated use cases should be analyzed to
understand their individual requirements. This might require
support for multiple scoring techniques or methods.
- Usability vs. Completeness: Associated metrics must balance
usability with completeness, i.e., they cannot be too complex.
- Prioritization Flexibility: Environmental conditions and
business/mission priorities should impact how scores are generated and
interpreted.
Appendix D: Generalized Scoring Approaches
While CWSS 1.0 is focused on targeted scoring, it could be further
adapted for scoring weaknesses in a general fashion, e.g. to develop a
relative prioritization of issues such as buffer overflows, XSS, and
SQL injection, independent of any specific software package.
A generalized scoring approach could account for:
- Prevalence: how often does this appear at least once within a software package?
- Frequency: in a software package in which this weakness occurs, how often does it occur? (perhaps summarized as "diffusion")
- Likelihood of Discovery
- Likelihood of Exploit
- Technical Impact
In the earlier CWSS 0.1, the formula was:
Prevalence x Importance
This formula was a characterization of the metric used for the 2010 CWE/SANS Top 25. Importance was derived from the vignette-specific
subscores for Technical Impacts of the CWE entry. Prevalence could be
obtained from general information (derived from CWE content, or from
other sources), with the possibility of vignette-specific
specifications of prevalence. For example, XSS or SQL injection might
occur more frequently in a web-based retail context than in embedded
software.
D.1 Prevalence Assessment
In the earlier CWSS version 0.1, prevalence scores for the 2010 Top
25 were obtained by re-using raw voting data from the 2010 Top 25
participants. The original 1-4 scale (with discrete values) was
extended to use values between 1 and 10. When using real-world
prevalence data, this artificial normalization might not be
necessary.
The following table summarizes the prevalence scores for some of
the Top 25 entries. Notice the high prevalence value for XSS; this
reflects the fact that nearly all of the voting members scored XSS as
"Widespread." Complete
details are available on a separate page.
| Top 25 Rank | CWE | Name | Prevalence (1-10) |
|---|
|
[1]
|
CWE-79
|
XSS
|
9.46
|
|
[2]
|
CWE-89
|
SQL Injection
|
7.43
|
|
[3]
|
CWE-120
|
Classic Buffer Overflow
|
6.04
|
|
[4]
|
CWE-352
|
Cross-site Request Forgery
|
7.75
|
|
[16]
|
CWE-209
|
Information Exposure Through an Error Message
|
7.11
|
Appendix E: Aggregated Scoring Methods: Measuring Weakness Surface
For years, software consumers have wanted clear guidance on how
secure a software package is, but the only available methods have been
proprietary, crude, or indirect, such as:
- Crude methods, such as counting the number and/or severity of
publicly reported vulnerabilities
- Proprietary methods developed by consultants or tool developers
- Indirect methods, such as the attack surface metric, which likely
has a strong association with overall software security, although
this has not necessarily been empirically proven.
A software package could be evaluated in light of the number and
importance of weaknesses that have been detected, whether from
automated or manual techniques. The results from these individual
weaknesses could be aggregated to develop a single score, tentatively
called the "Weakness Surface." This could move the software
assurance community one step closer to consumer-friendly software
security indicators such as the
Software Facts Label concept, as originally proposed by Jeff
Williams (Aspect Security)
and Paul Black (NIST).
When there is a set of targeted weaknesses for a single software
package, there are several possible aggregated scoring methods,
including but not necessarily limited to:
- Compute the sum of all individual weakness scores
- Choose the highest of all individual weakness scores
- Select a subset of individual weakness scores exceeding a stated
minimum, and add the scores together
- Compute the sum of all individual weakness scores, then normalize
these scores according to KLOC or other metrics that reflect code
size, i.e., "defect density."
- Normalize the results on a per-executable basis.
- Normalize the results to a point scale between 0 (no assurance)
and 100 (high assurance).
Early CWSS implementations have typically aggregated based on
either the sum of all scores, or by choosing the highest of all
scores.
Some methods from the 2008 CWSS kickoff workshop may be adaptable
or applicable; see Appendix B. In addition,
some SCAP users have begun creating aggregated metrics for a host
system by aggregating CVSS scores for the individual CVE
vulnerabilities that are detected on the host. These users may have
some useful guidance for the CWSS approach to aggregate scoring.
Change Log
| Date | Document Version | Notes |
|---|
|
September 5, 2014
|
1.0.1
|
Changed 4.2 example ("Wiki with limited business criticality")
vector weights to use 1.0 instead of 1, for consistenc with the 4.1
example. Credit: an external contributor.
Changed 4.2 example ("Wiki with limited business criticality")
vector values "AS:L" to "AS:W" and "AV:N" to "AV:I". The example was
using values that were valid for 0.8 but changed (i.e., made obsolete)
in 1.0. Credit: an external contributor.
Changed 4.2 example ("Wiki with limited business criticality") to
include table listing vector values.
Added description for Default value in Prevalence (P) table.
|
|
July 17, 2014
|
1.0
|
Removed Authentication Instances (AI). The CVSSv3 team found that in
this factor, the Multiple value was "rarely, if ever, used" within
several real-world implementations of CVSSv2, and the CVSS SIG will
remove this factor in CVSSv3. In addition, within CVSSv2, there was
sometimes user confusion between this factor and the Access Vector's
"Local" value that could cause inconsistent values to be chosen.
Removed Remediation Effort (RE). This factor does not directly
contribute to the inherent risk or severity of a weakness, so it is
outside the scope of CWSS scoring. Remediation effort could be better
handled using separate processes within the context of a remediation
plan. For example, bug databases and external maintenance/release
processes might be more appropriate for recording this information.
Changed scoring formula to handle removal of AuthenticationInstances
and RemediationEffort. Within the Attack Surface Subscore, the
multiplier for LevelOfInteraction was adjusted from 10 to 15. Within
the Environmental Subscore, the multiplier for LikelihoodOfExploit was
increased from 3 to 4, which reflects current trends in vulnerability
management that place greater emphasis on likelihood of exploit than
raw CVSS scores.
Modified introduction.
Clarified distinction between CWSS and CVSS.
Created new images for metric groups and scoring, omitting factors
that were removed for 1.0.
Improve display of tables, formulas, etc.
Give numbers to sections.
Acquired Privilege (AP) - Default weight changed from 1.0 to 0.5
(typo).
Changed "Unk" code to "UK" everywhere. Listed "Unknown" description
in each factor.
Clarified and fixed values / definitions for AP, AL, RP, and RL.
Level of Interaction (IN) - changed codes to use only 1 to 2 uppercase
letters.
Deployment Scope (SC) - changed codes to use only 1 to 2 uppercase
letters.
|
|
June 27, 2011
|
0.8
|
Bumped up version number to synchronize with CWRAF.
|
|
June 23, 2011
|
0.6
|
Major changes to the formula to better reflect relative priorities of
the factors.
Modified Access Vector (AV) to include Internet, Intranet, and Private
Network values.
Renamed Remediation Cost (RC) to Remediation Effort (RE), and changed
the available values.
Changed External Control Effectiveness (EC) weight for "Complete" to
0.1, to reflect the possibility of accidental removal of the control
if the environment changes.
Modified values for Authentication Strength (AS) and added notes for
potential enhancements.
Modified weights for Prevalence (P) so the range of variation is more
narrow.
All weights for Unknown values were changed to 0.5 so that lack of
information does not over-emphasize scores; additional information can
move scores up or down, accordingly.
Changed Defense-in-Depth/"D" value to Indirect/"I" for internal and
external control effectiveness to avoid conflict with the Default/"D"
value.
Removed most references to vignettes, technical impact scorecards,
business value context, etc. - now covered in CWRAF.
Skipped version 0.5 to reflect maturity and for alignment with other
efforts.
|
|
April 26, 2011
|
0.4
|
Removed content that became part of Common Weakness Risk Analysis
Framework (CWRAF).
Reorganized metric groups.
Defined new factors - Business Impact, Acquired Privilege, Acquired
Privilege Layer.
Defined a new formula.
Added "Default" values to each factor.
|
|
March 7, 2011
|
0.3
|
Created overview images and shortened the introduction. Defined
technology groups, added more business domains, added more vignettes.
Annotated each factor that could be quantified. Updated stakeholders
section. Integrated CVSS descriptions into a single section. Added
more details on the scoring method, including CWSS vectors.
|
|
February 11, 2011
|
0.2
|
Added business domains, archetypes, and Business Value Context;
identified detailed factors; emphasized use of CWSS for targeted
scoring; reorganized sections; made other modifications based on
community feedback.
|
|
December 2, 2010
|
0.1
|
Initial version for review by limited audience
|


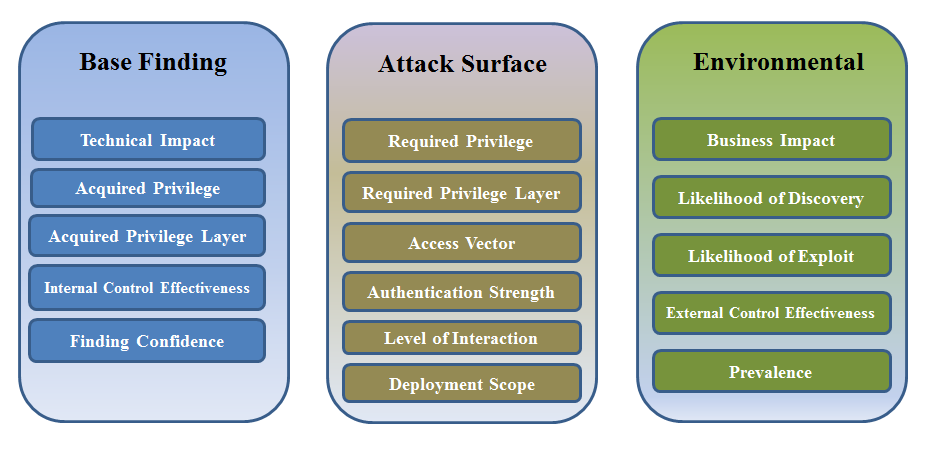
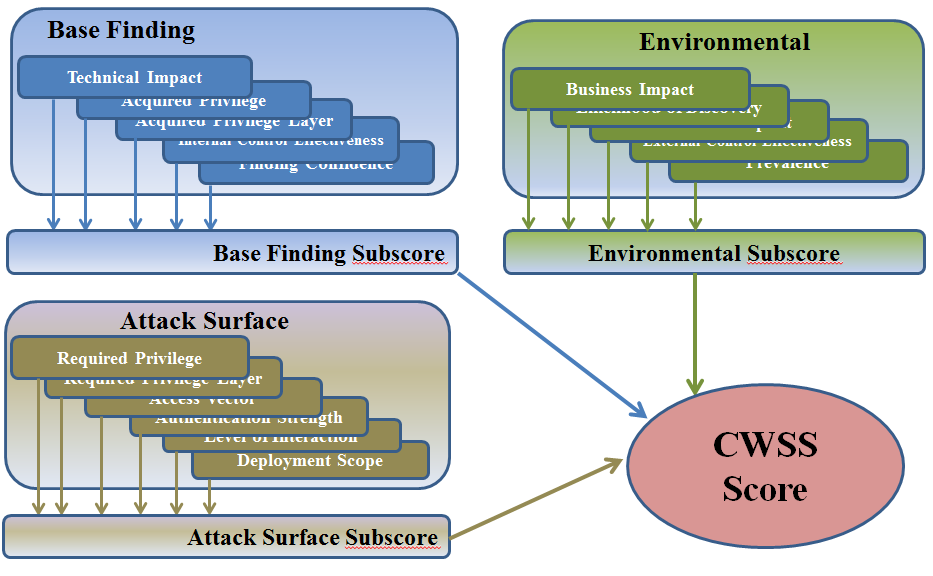