
Introduction
Introduction
When a security analysis of a software application is performed, such as when using an automated code auditing tool, developers often face hundreds or thousands of individual bug reports for weaknesses that are discovered in their code. In certain circumstances, a software weakness can lead to an exploitable vulnerability. For example, a buffer overflow vulnerability might arise from a weakness in which the programmer does not properly validate the length of an input buffer. This weakness only contributes to a vulnerability if the input can be influenced by a malicious party, and if that malicious input can copied to an output buffer that is smaller than the input. Due to the high volume of reported weaknesses, developers are forced into a situation in which they must prioritize which issues they should investigate and fix first. Similarly, when assessing design and architecture choices and their weaknesses, there needs to be a method for prioritizing them relative to each other and with the other issues of the application. Finally, software consumers want to know what they should worry about the most, and what to ask for to get a more secure product from their vendors and suppliers. Further complicating the problem, the importance of a weakness may vary depending on business or mission needs, the kinds of technologies in use, and the threat environment. In short, people need to be able to reason and communicate about the relative importance of different weaknesses. While various scoring methods are used today, they are either ad hoc or inappropriate for application to the still-imprecise evaluation of software security. The Common Weakness Scoring System (CWSS) provides a mechanism for scoring weaknesses in a consistent, flexible, open manner while accommodating context for the various business domains. It is a collaborative, community-based effort that is addressing the needs of its stakeholders across government, academia, and industry. CWSS is a part of the Common Weakness Enumeration (CWE) project, co-sponsored by the Software Assurance program in the office of Cybersecurity and Communications of the U.S. Department of Homeland Security (DHS). CWSS:
Table of Contents
Table of Contents
Stakeholders
Stakeholders
To be most effective, CWSS supports multiple usage scenarios by different stakeholders who all have an interest in a consistent scoring system for prioritizing software weaknesses that could introduce risks to products, systems, networks and services. Some of the primary stakeholders are listed below.
CWSS Design Considerations
CWSS Design Considerations
For CWSS to be most effective to its stakeholders, several aspects of the problem area must be considered when designing the framework and metrics. Some of these considerations might not be resolved until several revisions of CWSS have been released and tested.
Scoring Methods within CWSS
Scoring Methods within CWSS
The stakeholder community is collaborating with MITRE to investigate several different scoring methods that might need to be supported within the CWSS framework.
The current focus for CWSS is on the Targeted scoring method and a framework for context-adjusted scoring. Methods for aggregated scoring will follow. Generalized scoring is being developed separately, primarily as part of the 2011 Top 25 and CWRAF. CWSS 0.6 Scoring for Targeted Software
CWSS 0.6 Scoring for Targeted Software
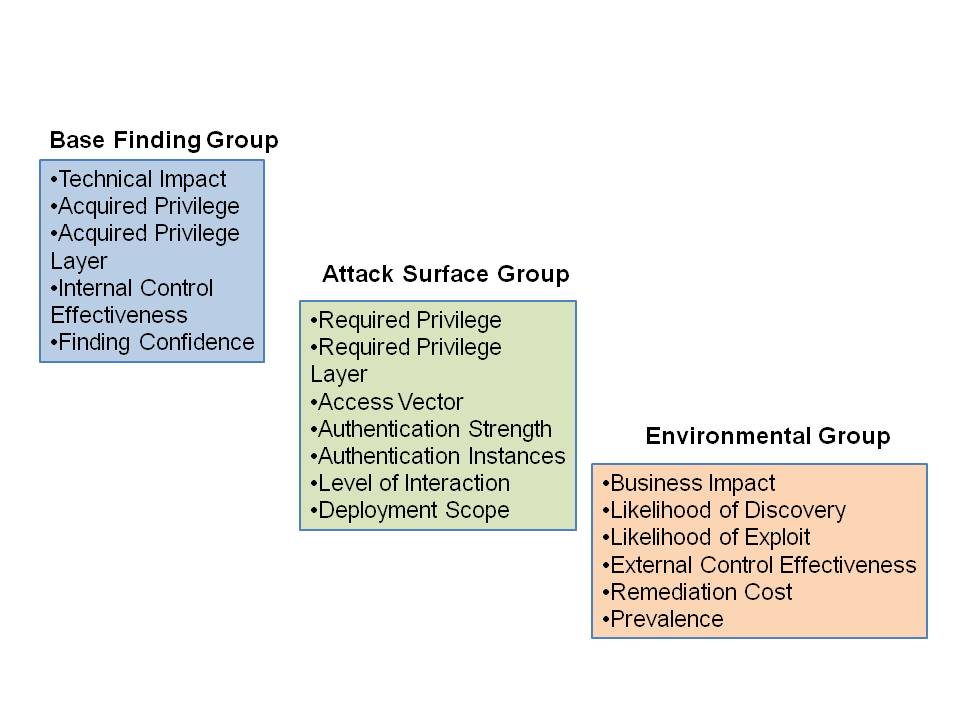
In CWSS 0.6, the score for each reported weakness (finding) is calculated using 18 different factors in three metrics groups. ScoringIn CWSS 0.6, the score for a weakness, or a weakness bug report ("finding") is calculated using 18 different factors, across three metric groups:
 (A larger picture is available.) CWSS Metric GroupsCWSS can be used in cases where there is little information at first, but the quality of information can improve over time. It is anticipated that in many use-cases, the CWSS score for an individual weakness finding may change frequently, as more information is discovered. Different entities may evaluate separate factors at different points in time. As such, every CWSS factor effectively has "environmental" or "temporal" characteristics, so it is not particularly useful to adopt the same types of metric groups as are used in CVSS.
Supporting Uncertainty and Flexibility Within Factors
Supporting Uncertainty and Flexibility Within Factors
Most factors have three values in common:
Base Finding Metric Group
Base Finding Metric Group
The Base Finding metric group consists of the following factors:
The combination of values from Technical Impact, Acquired Privilege, and Acquired Privilege Layer gives the user some expressive power. For example, the user can characterize "High" Technical Impact with "Administrator" privilege at the "Application" layer. Technical Impact (TI)Technical Impact is the potential result that can be produced by the weakness, assuming that the weakness can be successfully reached and exploited. This is expressed in terms that are more fine-grained than confidentiality, integrity, and availability.
If this set of values is not precise enough, CWSS users can use their own Quantified methods to derive a subscore. One such method involves using the Common Weakness Risk Analysis Framework (CWRAF) to define a vignette and a Technical Impact Scorecard. The Impact weight is calculated using vignette-specific Importance ratings for different technical impacts that could arise from exploitation of the weakness, such as modification of sensitive data, gaining privileges, resource consumption, etc. Acquired Privilege (AP)The Acquired Privilege identifies the type of privileges that are obtained by an entity who can successfully exploit the weakness. In some cases, the acquired privileges may be the same as the required privileges, which implies either (1) "horizontal" privilege escalation (e.g. from one unprivileged user to another), or (2) privilege escalation within a sandbox, such as an FTP-only user who can escape to the shell. Notice that the values are the same as those for Required Privilege, but the weights are different. The aconym "RUGNAP" can serve as a mnemonic for remembering the key values ("Regular User", "Guest", "None", "Admin", "Partially-Privileged").
Note that this factor can not be quantified. Acquired Privilege Layer (AL)The Acquired Privilege Layer identifies the operational layer to which the entity gains access if the weakness can be successfully exploited. A mnemonic for this factor is "SANE" (System, Application, Network, Enterprise).
Note that this factor can not be quantified. Internal Control Effectiveness (IC)An Internal Control is a control, protection mechanism, or mitigation that has been explicitly built into the software (whether through architecture, design, or implementation). Internal Control Effectiveness measures the ability of the control to render the weakness unable to be exploited by an attacker. For example, an input validation routine that restricts input length to 15 characters might be moderately effective against XSS attacks by reducing the size of the XSS exploit that can be attempted.
Note that this factor can not be quantified. Finding Confidence (FC)Finding Confidence is the confidence that the reported issue:
Attack Surface Metric Group
Attack Surface Metric Group
The Attack Surface metric group consistes of the following factors:
Required Privilege (RP)The Required Privilege identifies the type of privileges required for an entity to reach the code/functionality that contains the weakness. The aconym "RUGNAP" can serve as a mnemonic for remembering the key values ("Regular User", "Guest", "None", "Admin", "Partially-Privileged").
Note that this factor can not be quantified. Required Privilege Layer (RL)The Required Privilege Layer identifies the operational layer at which the entity must have access if the weakness can be successfully exploited. A mnemonic for this factor is "SANE" (System, Application, Network, Enterprise).
Note that this factor can not be quantified. Access Vector (AV)The Access Vector identifies the channel through which an entity must communicate to reach the code or functionality that contains the weakness. Note that these values are very similar to the ones used in CVSS, except CWSS distinguishes between physical access and local (shell/account) access. While there is a close relationship between Access Vector and Required Privilege Layer, the two are distinct. For example, an attacker with "physical" access to a router might be able to affect the Network or Enterprise layer.
Note that this factor can not be quantified. Authentication Strength (AS)The Authentication Strength covers the strength of the authentication routine that protects the code/functionality that contains the weakness. The values for this factor still need to be defined more clearly. It might be reasonable to adopt approaches such as the four levels outlined in NIST Special Publication 800-63 ("Electronic Authentication Guideline") and OMB Memo 04-04. However, since the strength of an authentication mechanism may degrade over time due to advances in attack techniques or computing power, it might be useful to select values that are effectively "future-proof." (On the other hand, this might make it difficult to compare CWSS scores if they were assigned at different times.)
Note that this factor can not be quantified. Authentication Instances (AI)Authentication Instances covers the number of distinct instances of authentication that an entity must perform to reach the weakness.
Note that this factor can not be quantified. Level of Interaction (IN)The Level of Interaction covers the actions that are required by the human victim(s) to enable a successful attack to take place.
Note that this factor can not be quantified. Deployment Scope (SC)Deployment Scope identifies whether the weakness is present in all deployable instances of the software, or if it is limited to a subset of platforms and/or configurations. For example, a numeric calculation error might only be applicable for software that is running under a particular OS and a 64-bit architecture, or a path traversal issue might only affect operating systems for which "\" is treated as a directory separator. The "RAMP" acronym can serve as a mnemonic for the key values (Rare, All, Moderate, Potential).
Note: this factor was called "Universality" in CWSS 0.2. Note that "Potentially Reachable" has some overlap with "Locally True" in the Finding Confidence (FC) factor. Environmental Metric Group
Environmental Metric Group
The Environmental metric group consistes of the following factors:
Business Impact (BI)Business Impact describes the potential impact to the business or mission if the weakness can be successfully exploited. Note: since business concerns vary widely across organizations, CWSS 0.6 does not attempt to provide a more precise breakdown, e.g. in terms of financial, reputational, physical, legal, or other types of damage. This factor can be quantified to support any externally-defined models.
Likelihood of Discovery (DI)Likelihood of Discovery is the likelihood that an attacker can discover the weakness.
Note that this factor has been used in some prioritization schemes in the past, such as Discoverability in Microsoft's DREAD classification scheme. However, it is being considered for removal in future versions of CWSS. There are a few considerations:
Likelihood of Exploit (EX)Likelihood of Exploit is the likelihood that, if the weakness is discovered, an attacker with the required privileges/authentication/access would be able to successfully exploit it.
Note that this factor is influenced by the Impact of a weakness, since attackers often target weaknesses that have the most severe impacts. Alternately, they may target weaknesses that are easy to trigger. It is also influenced by other factors such as the effectiveness of internal and external controls. It might seem that the prevalence is also an influence, but prevalence is more closely related to Likelihood of Discovery. External Control Effectiveness (EC)External Control Effectiveness is the capability of controls or mitigations outside of the software that may render the weakness unable to be reached or triggered by an attacker. For example, Address Space Layout Randomization (ASLR) and similar technologies reduce, but do not eliminate, the chances of success in a buffer overflow attack. However, this is not directly instantiated within the software itself.
Note that this factor can not be quantified. Remediation Effort (RE)Remediation Effort (RE) is the amount of effort required to remediate the weakness so that it no longer poses a security risk to the software.
Note that the proposed weights reflect a bias that weaknesses that are more expensive to fix will have higher scores than the same types of weaknesses that are less expensive to fix. This factor might be removed from future versions of CWSS. There are a few points of debate:
Prevalence (P)The Prevalence of a finding identifies how frequently this type of weakness appears in software. When scoring an individual weakness finding in an automated-scanning context, this factor is likely to be scored with a "Not Applicable" value. This factor is typically used during development of custom Top-N weakness lists, as opposed to scoring an individual finding in an automated-scanning context. Since software can be successfully attacked even in the presence of a single weakness, the selected weights do not provide significant distinction between each other.
CWSS Score Formula
CWSS Score Formula
A CWSS 0.6 score can range between 0 and 100. It is calculated as follows:
Base Finding SubscoreThe BaseFindingSubscore supports values between 0 and 100. Both the AttackSurfaceSubscore and EnvironmentSubscore support values between 0 and 1. The Base Finding subscore (BaseFindingSubscore) is calculated as follows:
The maximum potential BaseFindingSubscore is 100. The definition of f(TechImpact) has an equivalent in CVSS. It is used to ensure that if the Technical Impact is 0, that the other added factors do inadverently generate a non-zero score. TechnicalImpact and the AcquiredPrivilege/AcquiredPrivilegeLayer combination are given equal weight, each accounting for 40% of the BaseFindingSubscore. (Each generate a sub-value with a maximum of 10). There is some adjustment for Finding Confidence, which accounts for 20% of the Base (maximum of 5). The InternalControlEffectiveness can adjust the score downward, perhaps to 0, depending on the strength of any internal controls that have been applied to the issue. After application of InternalControlEffectiveness, the possible range of results is between 0 and 25, so the 4.0 coefficient is used to adjust the BaseFindingSubscore to a range between 0 and 100. Attack Surface SubscoreThe AttackSurfaceSubscore is calculated as:
The combination of required privileges / access makes up 60% of the Attack Surface subscore; deployment scope, another 20%; interaction, 10%; and authentication, 10%. The authentication requirements are not given much focus, under the assumption that strong proof of identity will not significantly deter an attacker from attempting to exploit the vulnerability. This generates a range of values between 0 and 100, which are then divided by 100. Environmental SubscoreThe EnvironmentalSubscore is calculated as:
BusinessImpact accounts for 50% of the environmental score, and it can move the final score to 0. ExternalControlEffectiveness is always non-zero (to account for the risk that it can be inadvertently removed if the environment changes), but otherwise it can have major impact on the final score. The combination of LikelihoodOfDiscovery/LikelihoodOfExploit accounts for 30% of the score, with Prevalence at 15% and RemediationEffort at an additional 5%. Additional Features of the FormulaSince "Not Applicable" values have a weight of 1, the formula always has a potential maximum score of 100.0. In extremely rare cases in which certain factors are treated as not-applicable (e.g., Technical Impact, Business Impact, *and* Internal Control Effectiveness), then the minimum possible score would be non-zero. There is significant diversity in the kinds of scores that can be represented, although the use of multiplication of many different factors, combined with multiple weights with small values, means that the range of potential scores is somewhat skewed towards lower values, although this is still a significant improvement over previous CWSS versions. When default values are used for a large number of factors for a single score, using the median weights as defined in CWSS 0.6, the scores will skew heavily to the low side. The median weight for a factor does not necessarily reflect the most likely value that could be used, so the selection of Default weights may be changed in future versions. Ideally, the formula would have a property in which the use of many default values produces a score that is relatively close to 50; the selection of non-default values would adjust the final score upward or downward, thereby increasing precision. The use of "Unknown" values also generally produces scores that skew to the low side. This might be a useful feature, since scores will be higher if they have more specific information. CWSS Vectors, Scoring, and Score Portability
CWSS Vectors, Scoring, and Score Portability
With the abbreviations as specified above, a CWSS score can be stored in a compact, machine-parsable, human-readable format that provides the details for how the score was generated. This is very similar to how CVSS vectors are constructed. Unlike CVSS, not all CWSS factors can be described symbolically with discrete values. Several factors can be quantified with continuous weights that override the originally-defined default discrete values. When calculated using CWRAF, the Impact factor is effectively an expression of 32 separate Technical Impacts and layers, many of which would not be applicable to a particular weakness. Treating each impact as a separate factor would roughly double the number of factors required to calculate a CWSS score. In addition, the use of Business Value Context (BVC) to adjust scores for business-specific concerns also means that a CWSS score and its vector may appear to be inconsistent if they are "transported" to other domains or vignettes. With this concern in mind, a CWSS 0.6 vector should explicitly list the weights for each factor, even though it increases the size of the vector representation. The format of a single factor in a CWSS vector is:
For example, "P:NA,1.0" specifies a "Not Applicable" value for Prevalence with a weight of 1.0. A specifier of "AV:P,0.2" indicates the "Physical" value for Access Vector with a weight of 0.2. Factors are separated by forward slash characters, such as:
which lists values and weights for "AV" (Access Vector), "RP" (Required Privilege Level), and "AS" (Authentication Strength). Example 1: Business-critical applicationConsider a reported weakness in which an application is the primary source of income for a company, thus has critical business value. The application allows arbitrary Internet users to sign up for an account using only an email address. A user can then exploit the weakness to obtain administrator privileges for the application, but the attack cannot succeed until the administrator views a report of recent user activities - a common occurrence. The attacker cannot take complete control over the application, but can delete its users and data. Suppose further that there are no controls to prevent the weakness, but the fix for the issue is simple, and limited to a few lines of code. This situation could be captured in the following CWSS vector:
The vector has been split into multiple lines for readability. Each line represents a metric group. The factors and values are as follows:
The CWSS score for this vector is 93.1, derived as follows:
The final score is:
Example 2: Wiki with limited business criticalityConsider this CWSS vector. Suppose the software is a wiki that is used for tracking social events for a mid-size business. Some of the most important characteristics are that there is medium technical impact to an application administrator from a regular user of the application, but the application is not business-critical, so the overall business impact is low. Also note that most of the environment factors are set to "Not Applicable."
The CWSS score for this vector is 50.5, derived as follows:
The final score is:
If the Business Impact (BI) is set to Medium instead, then the score would rise to 62.2; if set to High, then 73.8; and if set to Critical, then the score would be 83.8. (Since the Technical Impact is only "Medium," the maximum CWSS score cannot be 100.) Other Approaches to CWSS Score PortabilityInstead of recording each individual weight within a CWSS vector, several other methods could be adopted. One approach would be to attach BVC metadata such as the Technical Impact Scorecard to a set of generated CWSS scores, but it could be too easy for this metadata to become detached from the scores/vectors. Quantified factors would still need to be represented within a vector, since they could vary for each weakness finding. Another approach is that when CWSS scores are transferred from one party to the other, but a BVC is not included, then the receiving party should re-calculate the scores from the given CWSS vectors, then compare the re-calculated scores with the original scores. A difference in scores would suggest that different BVCs are in use between the provider and receiver. Considerations for CWSS beyond 0.6
Considerations for CWSS beyond 0.6
For future versions, the following should be considered. Current Limitations of the Scoring MethodThe formula in CWSS 0.6 is an improvement over the previous versions, but it still needs to be refined to ensure that the range of potential scores is more evenly distibuted. (In CWSS 0.3, the final CWSS scores were heavily skewed to low values between 0.0 and 2.0 out of a potential score of 100.0; in CWSS 0.4, there was a greater balance in potential scores, but many factors were weighed too closely together, and the generated scores still were not intuitive.) There are probably unexpected interactions between factors that must be identified and resolved. CVSS scoring contains built-in adjustments that prevent many factors from affecting the score too much, while also giving some preference to impact over exploitability; similar built-in adjustments may need to be performed for CWSS. CWSS 0.6 provides users with some ability to give higher scores to design/architecture issues in comparison with implementation errors, which is an improvement over previous versions, but perhaps still insufficient. This approach is important in some contexts, such as when a single report of "lack of an input validation framework" is expected to carry more weight than multiple individual XSS and SQL injection bugs. The Remediation Effort factor allows users to adjust priority of design/architecture issues, since they typically require more effort to fix than implementation bugs. The Business Impact factor can also be used. This discrepancy might be also resolved with manual, CWRAF-oriented, weakness-specific scoring, but the process as defined in CWSS 0.6 does not make any such distinctions. CWE data could be mined to determine whether the weakness is in implementation or in design/architecture, so this knowledge could be obtained automatically; however, the boundary between design and implementation is usually not well-defined, and many CWE entries could occur in either phase. There are also some challenges for scoring findings that combine multiple weaknesses. By their nature, compound elements such as chains and composites involve interactions between multiple reported weaknesses. With some detection techniques such as automated code scanning, multiple CWE entries might be reported as separate findings for a single chain or composite. This might artificially inflate any aggregate scoring, since the results might be double-counted for each entry within the chain or composite. However, sometimes the compound element is more than the sum of its parts, and the combination of multiple weaknesses has a higher impact than the maximum impact of any individual weakness. This is not well-handled in the current CWSS scheme; chains and composites are a relatively new concept, and they are likely difficult to identify automatically with code analysis. This challenge is probably beyond the scope of CWSS. It is anticipated that CWSS may be considered for use in other types of software assessments, such as safety, reliability, and quality. Weaknesses or other issues related to code quality might receive higher prioritization within a vignette-oriented scheme, since safety, compliance, or maintainability might be important. This usage is not explicitly supported with CWSS 0.6. However, such quality-related issues could be scored in which the Required Privilege is the same as Acquired Privilege, and the Required Privilege Layer is the same as the Acquired Privilege Layer; the Business Impact could also be used. Community Review and Validation of FactorsPending community review, future versions of CWSS might modify, remove, or add factors to the methodology. Some factors might be removed based on community feedback. Some of the more controversial examples are Remediation Effort and Likelihood of Discovery. The reasons for potential removal are described in the detailed descriptions for each factor. Note that each factor supports a "Not Applicable" value that does not impact the final CWSS score. If there are enough stakeholders or use-cases for whom the factor is important, then this would be a strong argument for keeping the factor within CWSS, even if it is not essential for everyone. The "Not Applicable" value could be used for scoring contexts in which the given factor is not relevant. Additional CWSS FactorsAs CWSS matures, additional factors might become an essential part of future versions of the framework. The "Weakness Scope" factor could be used to cover the following scenario. Within CWSS 0.3, design and architecture flaws receive the same relative priority as implementation issues, even though they may lead to a complete compromise of the software. It may be reasonable to use a separate factor in order to give design/architecture flaws a larger weight, e.g. so that the lack of an input validation framework (one "finding") can be given higher priority than hundreds of individual findings for XSS or SQL injection. Note that there is already some relationship with the "Extensive" value of the Remediation Effort factor, but in CWSS 0.6, this value reduces the overall score, and the Remediation Effort factor is being considered for removal from CWSS. In previous versions of this paper before CWSS 0.6, several other CWSS factors were proposed, but they generally fell under the "business impact" category. Constituency-focused ScoringWithin a vignette, there are often different users and communicating organizations that all use the same system or system-of-systems. These form separate consituencies. When performing scoring, the score might vary depending on the perspective of:
An individual weakness finding within a specific, targeted package could have different scores for each of these constituencies. In CWSS 0.6, this is now partially handled by using the SANE model of privilege layers (System, Application, Network, Enterprise), although only one combination of privilege/layer can be specified for a single CWSS score. Supporting multiple scores for a single finding might introduce too much additional complexity into CWSS. This constituency separation could be handled using CWRAF's vignette model by defining one low-level vignette for the application's users, one for the application itself, one for the physical host, etc. Impact of CWSS and CWE Changes to Factors and SubscoresThe values for the factors involved in scoring might change frequently, especially for early versions of CWSS. For example, the likelihood of discovery of a particular weakness may change - rising if detection techniques improve (or if there is a shift in focus because of increases in attacks), or falling if enough developers have methods for avoiding the weakness, and/or if automatic protection mechanisms reach wide-scale adoption. In the future, default values for some factors might be directly obtained from CWE data. However, new CWE versions are released on a regular basis, approximately 4 or 5 times a year. If a CWE entry is modified in a way that affects CWSS-related factors, then the resulting CWSS score for a weakness might differ depending on which version of CWE is used. Theoretically, however, this could be automatically detected by observing inconsistencies in the weights used for "Default" values in CWSS vectors. Because of these underlying changes, there is a significant risk that CWSS scores will not be comparable across organizations or assessments if they were calculated using different versions of CWSS, vignettes, or CWE. In anticipation of such changes, CWSS design should consider including CWE and/or CWSS version numbers in the CWSS vector representation (or associated metadata). Finally, these changes should not occur too frequently, since each change could cause CWSS scores to change unpredictably, causing confusion and possibly interfering with strategic efforts to fix weaknesses whose importance has suddenly been reduced. CVSS encountered these problems when changing from version 1 to version 2, and there were significant labor costs to re-score vulnerabilities, which numbered in the tens of thousands. As a result of this, there has been significant reluctance by the CVSS SIG to make any substantive changes beyond version 2. Although this may be inevitable for CWSS as a natural result of growth, the community should attempt to prevent this from happening where possible. While scores may change as CWSS and CWE evolve, there is not necessarily a requirement for an organization to re-score whenever a new version is released, especially if the organization is using CWSS for internal purposes only. The variability of scores is largely a problem for sharing scores between organizations. For example, a software developer may have its own internally-defined vignettes and BVC, so the developer may not have a need (or willingness) to share CWSS scores outside the organization. Future Activities
Future Activities
The majority of the development and refinement of the first major version of CWSS will occur during 2011. Current plans include:
Community Participation in CWSS
Community Participation in CWSS
Currently, members of the software assurance community can participate in the development of CWSS in the following ways:
Appendix A: CVSS
Appendix A: CVSS
The Common Vulnerability Scoring System (CVSS) is commonly used when ranking vulnerabilities as they appear in deployed software. CVSS provides a common framework for consistently scoring vulnerabilities. Conceptually, CVSS and CWSS are very similar. There are some important strengths and limitations with CVSS, however. One of CVSS' strengths lies in its simplicity. CVSS divides the overall score into 14 separate characteristics within three metric groups: Base, Temporal, and Environmental. Each characteristic is decomposed into two or more distinct values. For example, the Access Vector reflects the location from which an attacker must exploit a vulnerability, with possible values of Local (authenticated to the local system), Remote (across the network), or Network Adjacent (on the same physical or logical network). Typically, in addition to the CVSS score, a vector is provided that identifies the selected values for each characteristic. With the associated documentation, CVSS scoring is fairly repeatable, i.e., different analysts will typically generate the same score for a vulnerability. However, different scores can be generated when information is incomplete, and significant variation is possible if an analyst does not closely follow documentation. While the simplified Confidentiality/Integrity/Availability model does not provide the depth and flexibility desired by some security experts, CVSS does provide the consistency that is useful for non-expert system and network administrators for prioritizing vulnerabilities. CVSS has been widely adopted, especially the use of base scores from the Base metric group. Some organizations use the Temporal and Environmental portions of CVSS, but this is relatively rare, so these metric groups may not have been sufficiently vetted in the real world. CVSS in a Software Assurance ContextCVSS has some important limitations that make it difficult to adapt to software security assessment. There are some significant aspects of CVSS that make it difficult for direct use within a weakness-scoring context.
The development of CWSS will seek to preserve the strengths of CVSS while also attempting to avoid some of the associated limitations. Adaptations of CVSSSeveral organizations have attempted to use or modify CVSS as a method for measuring levels of software security. Cigital performed a feasibility study of CVSSv2. More information is provided in Appendix B. Veracode uses an adaptation of CVSS to evaluate detected weaknesses/vulnerabilities. Each issue is given weights for Confidentiality, Integrity, and Availability, based on its associated CWE entry. The weighting considers the average likely severity to occur. For example, a buffer overflow could allow an attacker to cause a crash, but it is not always exploitable for code execution. For aggregated scores, Veracode has several "VERAFIED Security Marks" that are based on a calculated Security Quality Score (SQS), which ranges from 0 to 100. The "VerAfied" security mark is used to indicate software that Veracode has assessed to be free of "very high," "high," or "medium" severity vulnerabilities, and free of automatically-detectable vulnerabilities from the CWE/SANS Top 25 or OWASP Top Ten. Two "High Assurance" variations of the mark include a manual assessment step that covers the remainder of the CWE/SANS Top 25 or OWASP Top Ten that could not be identified by automatic detection. The Veracode Rating System uses a three-letter rating system (with grades of "F", "D", "C", "B", and "A"). The first letter is used for the results from binary analysis, the second for automated dynamic analysis, and the third for human testing. Comparison of CWSS Factors with CVSSNote that in CVSS, the Access Complexity (AC) value combines multiple characteristics that are split into distinct factors within CWSS, such as Required Privilege Level and Level of Interaction.
Other Differences between CVSS and CWSSSome reviewers of early CWSS versions suggested that CWSS adopt the same set of metric groups that are used by CVSS - Base, Temporal, and Environmental. However, since CWSS scores can be calculated in early, low-information scenarios, many factors are "temporal" in nature, and likely to change as further analysis yields more information about the weakness. CWSS supports the use of values such as "Unknown" or "Default", which can be filled in at a later time. One aspect of CVSS that is not explicitly modeled in CWSS is the notion of "partial" impacts. However, the acquired privileges, privilege layer, technical impact, andbusiness impact are roughly equivalent, with more expressive power. Appendix B: Other Scoring Methods
Appendix B: Other Scoring Methods
2008 CWSS Kickoff MeetingIn October 2008, a single-day kickoff meeting for CWSS was held. Several participants described their scoring approaches. Veracode reported their assignment of Confidentiality, Integrity, and Availability scores for CVSS-based assessment of CWE weaknesses. More details are provided in a later subsection. Cigital described a feasibility study of CVSSv2 with respect to weaknesses. Some attributes such as "Target Distribution" did not fit well. Other attributes were extended to add more granularity. A polynomial scoring method was recommended. It was also regarded as important to model the distinction between the likelihood and the impact. Cenzic provided details of the Hailstorm Application Risk Metric (HARM). It is a quantitative score that is utilized by black box analysis of web applications. The goal of the metric was to provide a scalable approach to focus remediation efforts. The metric was split into 4 impact areas relevant to web application security: the browser, the session, the web application, and the server. The benefit to this approach was that it was easily consumable. CERT/SEI presented its approach to scoring the C Secure Coding Rules. The FMECA metric, an ISO standard, was used. It characterizes items in terms of Severity, Likelihood (of leading to a vulnerability), and Remediation Cost. 2010 SANS/CWE Top 25The 2010 SANS/CWE Top 25 Most Dangerous Software Errors list attempted to perform quantitative prioritization of CWE entries using a combination of Prevalence and Importance, which became the basis of CWSS 0.1 later in the year. A survey approach was taken in which respondents performed their own individual evaluation of Prevalence and Importance for 41 candidate weaknesses, from which the final scores were determined. To reflect the diverse opinions and use cases of the respondents for the general Top 25 list, the Importance factor was used instead of Impact. In an attempt to force consensus, respondents were restricted to 4 selections of the highest value for Importance ("Critical") and Prevalence ("Widespread"), although this forced choice was not popular; it will probably be abandoned in future versions of the Top 25. Many respondents used high-level rollup data, or a rough consensus of opinion with the organization, sometimes covering multiple teams or functions. Very few respondents had real-world data at the low level of granularity used by the Top 25 (typically the "Base" level of abstraction for CWE). An evaluation by PlexLogic later found that the two variables were not entirely independent. This discovery makes some sense, because the vulnerability research community tends to focus on vulnerabilities/weaknesses with the highest impact. When reliable attack techniques are devised for a particular weakness/vulnerability, it becomes easier for more researchers to find them, which can lead to widespread exploitation. Consequently, this raises the relative Importance of a weakness. The 2010 Top 25 was structured in a way to support multiple points of view that could reflect different prioritizations of the weaknesses. The creation of separate focus profiles stemmed from some critiques of the original 2009 Top 25, in which a generalized Top 25 list would not necessarily be useful to all audiences, and that a customized prioritization would be ideal. Eight focus profiles were provided with the 2010 Top 25. For example, the Educational Emphasis focus profile evaluated weaknesses that are regarded as important from an educational perspective within a school or university context. It emphasized the CWE entries that graduating students should know, including weaknesses that were historically important or increased the breadth of coverage. A separate focus profile ranked weaknesses based solely on their evaluated Importance, which would be useful to software customers who want the most serious issues removed, without consideration for how frequently they occur or how resource-intensive it is to fix. These ranking-oriented focus profiles made the Top 25 more useful to certain audiences, and their construction and management have served as a useful predecessor to CWSS and vignettes. While the 2009 Top 25 did not rank items, several factors were presented that were thought to be relevant to an audience: attack frequency, impact or consequences, prevalence, and ease of detection. Other considerations included remediation cost, amount of public knowledge, and the likelihood that the weakness discovery would increase in the future. 2010 OWASP Top TenIn contrast to previous versions, the 2010 OWASP Top Ten shifted focus from weaknesses/vulnerabilities to risks, which typically caused each OWASP Top Ten entry to cover multiple related weakness types that posed the same risk. Factors for prioritization included Ease of Exploit, Prevalence, Detectability, and Technical Impact. Input from contributors was solicited to determine the values for these factors, but the final decision for each factor was made by the Top Ten editorial staff based on trend information from several real-world data sources. A metric was developed that used these factors to prioritize the final Top Ten list. Other ModelsMicrosoft's STRIDE model characterizes issues in terms of Spoofing Identity, Tampering with Data, Repudiation, Information Disclosure, Denial of Service, and Elevation of Privilege. The DREAD scheme evaluates issues based on Damage Potential, Reproducibility of the issue, Exploitability, Affected Users, and Discoverability. Many of these attributes have equivalent factors in CWSS. Appendix C: Generalized Scoring Approaches
Appendix C: Generalized Scoring Approaches
While CWSS 0.3 is focused on targeted scoring, it could be further adapted for scoring weaknesses in a general fashion, e.g. to develop a relative prioritization of issues such as buffer overflows, XSS, and SQL injection, independent of any specific software package. A generalized scoring approach could account for:
In the earlier CWSS 0.1, the formula was:
This formula was a characterization of the metric used for the 2010 CWE/SANS Top 25. Importance was derived from the vignette-specific subscores for Technical Impacts of the CWE entry. Prevalence could be obtained from general information (derived from CWE content, or from other sources), with the possibility of vignette-specific specifications of prevalence. For example, XSS or SQL injection might occur more frequently in a web-based retail context than in embedded software. Prevalence AssessmentIn the earlier CWSS version 0.1, prevalence scores for the 2010 Top 25 were obtained by re-using raw voting data from the 2010 Top 25 participants. The original 1-4 scale (with discrete values) was extended to use values between 1 and 10. When using real-world prevalence data, this artificial normalization might not be necessary. The following table summarizes the prevalence scores for some of the Top 25 entries. Notice the high prevalence value for XSS; this reflects the fact that nearly all of the voting members scored XSS as "Widespread." Complete details are available on a separate page.
Appendix D: Aggregated Scoring Methods: Measuring Weakness Surface
Appendix D: Aggregated Scoring Methods: Measuring Weakness Surface
For years, software consumers have wanted clear guidance on how secure a software package is, but the only available methods have been proprietary, crude, or indirect, such as:
A software package could be evaluated in light of the number and importance of weaknesses that have been detected, whether from automated or manual techniques. The results from these individual weaknesses could be aggregated to develop a single score, tentatively called the "Weakness Surface." This could move the software assurance community one step closer to consumer-friendly software security indicators such as the Software Facts Label concept, as proposed by Jeff Williams (OWASP) and Paul Black (NIST). When there is a set of targeted weaknesses for a single software package, there are several possible aggregated scoring methods, including but not necessarily limited to:
Some methods from the 2008 CWSS kickoff workshop may be adaptable or applicable; see Appendix B. In addition, some SCAP users have begun creating aggregated metrics for a host system by aggregating CVSS scores for the individual CVE vulnerabilities that are detected on the host. These users may have some useful guidance for the CWSS approach to aggregate scoring. Change Log
Change Log
|
||||||||||||||||||||||||||||||||||||||||||||||||||||||||||||||||||||||||||||||||||||||||||||||||||||||||||||||||||||||||||||||||||||||||||||||||||||||||||||||||||||||||||||||||||||||||||||||||||||||||||||||||||||||||||||||||||||||||||||||||||||||||||||||||||||||||||||||||||||||||||||||||||||||||||||||||||||||||||||||||||||||||||||||||||||||||||||||||||||||||||||||||||||||||||||||||||||||||||||||||||||||||||||||||||||||||||||||||||||||||||||||||||||||||||||||||||||||||||||||||||||||||||||||||||||||||||||||||||||||||||||||||||||||||||||||||||||||||||||||||||||||||||||||||||||||||||||||||||||||||||||||||||||||||||||||||||||||||||||||||||||||||||||||||||||||||||||||||||||||||||||||||||||||||||||||||||||||||||||||||||||||||||||||||||||||||||||||||||||||||||||||||||||||||||||||||||||||||||||||||||||||||||||||||||||||
